Free Republic
Browse · Search
News/Activism
Topics · Post Article

To: Gondring
"Comparing everything for the last 11 years to one abnormal peak in 1998 is not very good data-analysis technique. If you pick either the preceding or following year, you don’t see a cooling trend."

A linear fit of all 11 years shows a cooling trend.

50 posted on 11/25/2009 12:37:21 PM PST by avacado
[ Post Reply | Private Reply | To 33 | View Replies ]


To: avacado
A linear fit of all 11 years shows a cooling trend.

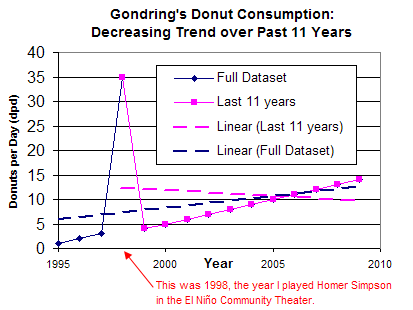
Since you don't see the point with the real climate data, here's a very quick simplified graph to illustrate why a linear regression trend taken from a statistical and physical anomaly is inappropriate handling of data. Note that this is an important consideration even if using a trend analysis technique like Mann-Kendall.

By your reasoning, I can claim that I have an 11-year (in magenta) downward trend of donut consumption, even though looking at the 10-year, 12-year lines, or whole dataset (navy) would give me a different result.

92 posted on 11/25/2009 6:38:51 PM PST by Gondring (Paul Revere would have been flamed as a naysayer troll and told to go back to Boston.)
[ Post Reply | Private Reply | To 50 | View Replies ]

Free Republic
Browse · Search
News/Activism
Topics · Post Article


FreeRepublic, LLC, PO BOX 9771, FRESNO, CA 93794
FreeRepublic.com is powered by software copyright 2000-2008 John Robinson