Skip to comments.
Photos of poorly sited weather stations - The global warming racket broken wide open
norcalblogs. ^
| 8 11 007
| Steve McIntyre
Posted on 08/12/2007 3:04:19 PM PDT by dennisw
click here to read article
Navigation: use the links below to view more comments.
first 1-20, 21-40, 41-53 next last
1
posted on
08/12/2007 3:04:21 PM PDT
by
dennisw
To: dennisw
LOL...no wonder they are getting such high readings. That Tucson station should register at least 130 over that hot parking lot in the summer. Doesn’t someone check these to see if they are properly sited?
To: dennisw
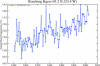
The changes in the U.S. history were not brought to the attention of readers by GISS itself, but in this post at climateaudit. As a result of the GISS revisions, there was a change in the “leader board” and >>>>>>
1934 emerged as the warmest U.S. year and more warm years were in the top ten from the 1930s than from the past 10 years. This has been widely discussed in the right-wing blogosphere and has been acknowledged at realclimate as follows:
3
posted on
08/12/2007 3:08:49 PM PDT
by
dennisw
To: dennisw
I heard on Bortz’s show that within 3 days of notification of these blunders, NASA pulled the locations of it’s weather stations off the internet.
4
posted on
08/12/2007 3:09:45 PM PDT
by
Rb ver. 2.0
(eHarmony reject)
To: kittymyrib
Doesn’t someone check these to see if they are properly sited?Turns out we can't trust gubbermint data. This is pure sloppiness bordering on conspiracy to jack up temperature readings because it will bolster the AlGore model
5
posted on
08/12/2007 3:11:28 PM PDT
by
dennisw
To: kittymyrib
This was done intentionally to hype global warming. These people know what they’re doing.
6
posted on
08/12/2007 3:14:14 PM PDT
by
ontap
(Just another backstabbing conservative)
To: kittymyrib
not if they want “different” results
7
posted on
08/12/2007 3:15:16 PM PDT
by
InvisibleChurch
(CLYBURN: Well, that would be a real big problem for us, no question about that.)
To: dennisw
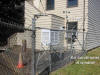
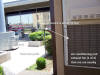
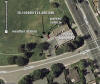
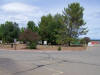
The picture below is of the
USHCN climate station of record for Newport Beach, CA When I first visited this site I did a double take. Then started searching for the “real” temperature sensor.


I couldn’t believe that NOAA allowed them to use consumer grade equipment. I was sure I just hadn’t located the MMTS sensor. It wasn’t unitl I looked up the MMS metadata entry for equipment for NB and saw “miscellaneous” listed for rain and temperature sensors, that I began to get concerned.
http://209.85.165.104/search?q=cache:E1hpGSHF0HEJ:www.climateaudit.org/%3Fp%3D1817+USHCN+noaa&hl=en&ct=clnk&cd=4&gl=us
8
posted on
08/12/2007 3:20:24 PM PDT
by
dennisw
To: Rb ver. 2.0
I heard on Bortz’s show that within 3 days of notification of these blunders, NASA pulled the locations of it’s weather stations off the internet.There was an uproar so they are back, at least that's what I read. www.surfacestations.org is the main instigator on our side. They and others are checking out each monitoring station
NOAA not NASA I think....... Actually the USHCN has those stations
"But, simply stated, McIntyre not only proved the error of the calculations used to interpret the data from the 1000 plus US Historical Climatology Network (USHCN) weather stations feeding GISS, but also the cascading effect of that error on past data."
9
posted on
08/12/2007 3:21:13 PM PDT
by
dennisw
To: dennisw
More Accurate

10
posted on
08/12/2007 3:21:53 PM PDT
by
Westlander
(Unleash the Neutron Bomb)
To: kittymyrib
Well of course they don’t care where they locate these critical monitoring sites! Why should they when they have AlGoreRhythms to correct for anything!
11
posted on
08/12/2007 3:24:15 PM PDT
by
Red_Devil 232
(VietVet - USMC All Ready On The Right? All Ready On The Left? All Ready On The Firing Line!)
To: dennisw
outrageous. one would almost be led to believe that the proximity of these things to heat producing objects is too egregious to be a coincidence.
Junk science, thug style.
To: dennisw
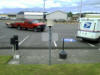
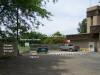
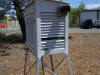
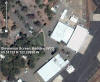
USHCN STATIONS used for the climate surface temperature record
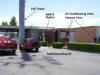
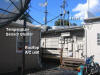
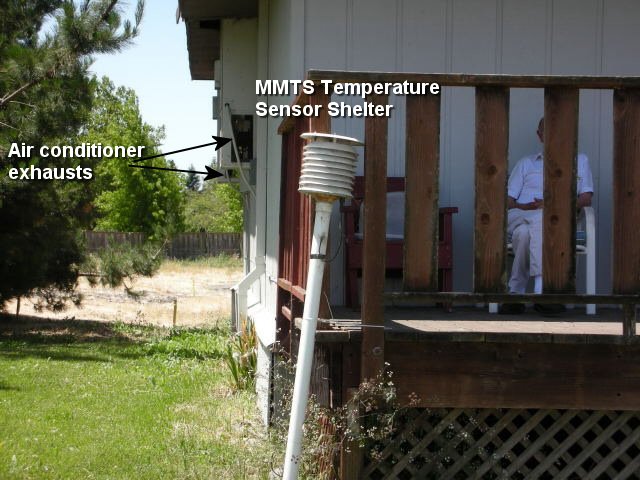
Forest Grove, OR (air conditioner exhaust blowing directly on temperature shelter, nearby asphalt and buildings)
More photos: http://gallery.surfacestations.org/main.php?g2_itemId=1493
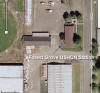
Marysville, CA (close by parking, air conditioners blowing exhaust near MMTS temp sensor, BBQ used by firefighters, cell phone tower base)
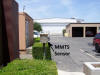
More photos: http://gallery.surfacestations.org/main.php?g2_itemId=660
Tahoe City, CA (burn barrel, close by parking, tennis court surface 25 feet away built in early 1980's)
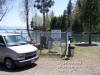
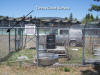
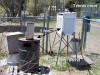
More photos: http://gallery.surfacestations.org/main.php?g2_itemId=694
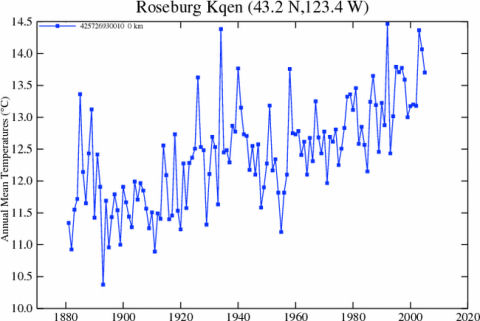
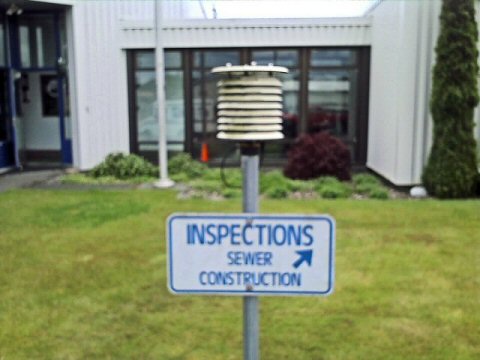
Roseburg, OR (MMTS shelter on roof, near a/c exhaust)
More photos: http://gallery.surfacestations.org/main.php?g2_itemId=1535
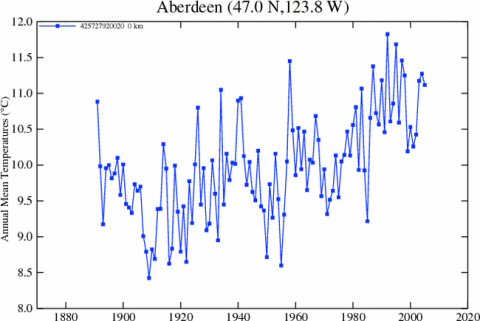
Aberdeen, WA ( large heat source: sewage treatment plant - nearby parking, hot automobile radiators )


More photos here: http://gallery.surfacestations.org/main.php?g2_itemId=4658
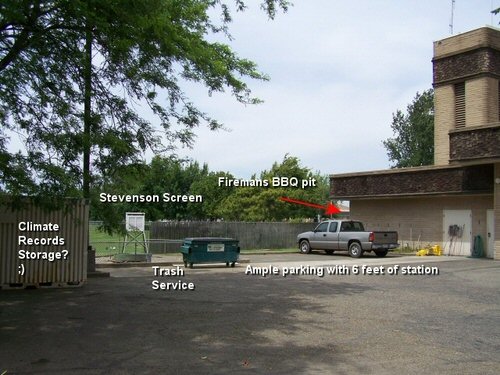
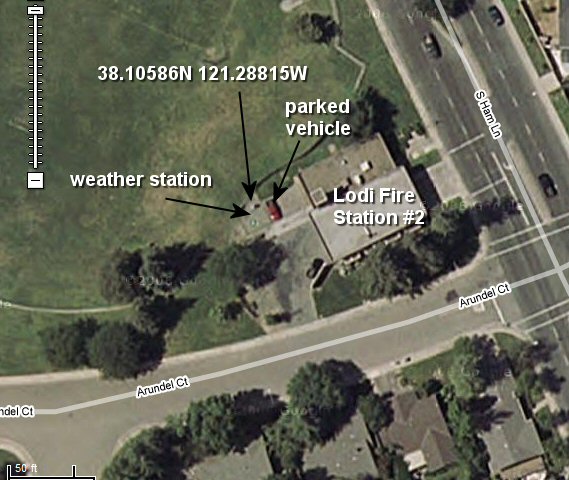
Lodi, CA (nearby parking, asphalt, dumpster, nearby building, storage container)
More photos: http://gallery.surfacestations.org/main.php?g2_itemId=658
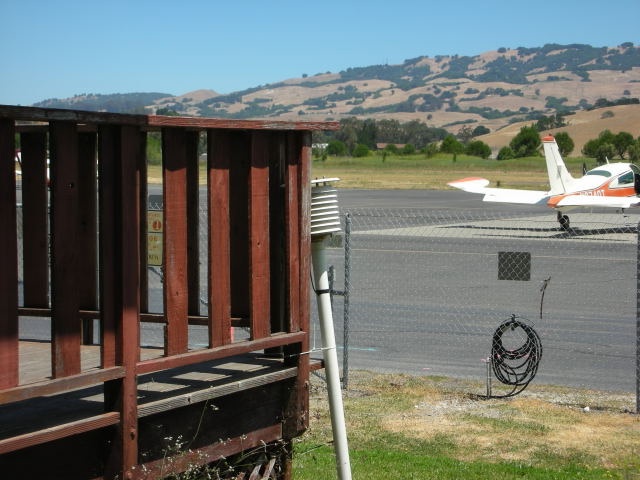
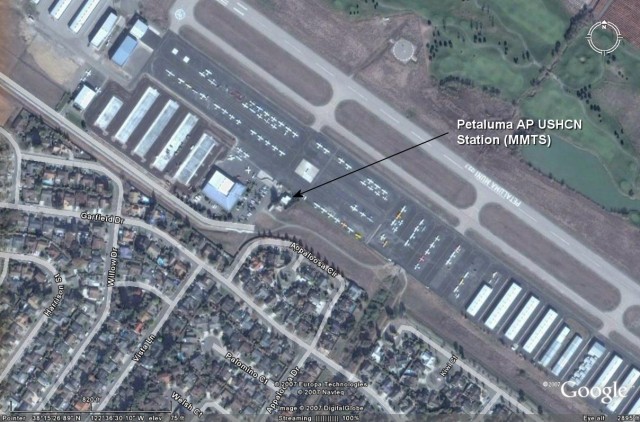
Petaluma, CA (a/c units nearby, MMTS strapped to deck, 6' from building, lots of nearby tarmac, prevailing wind UHI effect from SW)
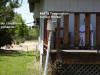


More photos: http://gallery.surfacestations.org/main.php?g2_itemId=680
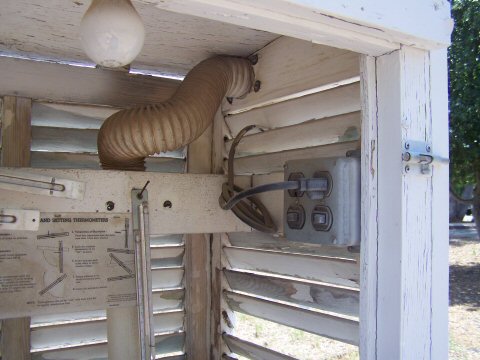
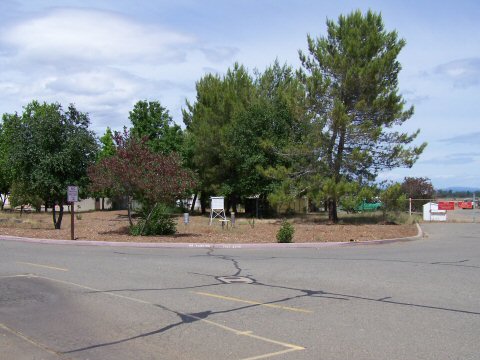
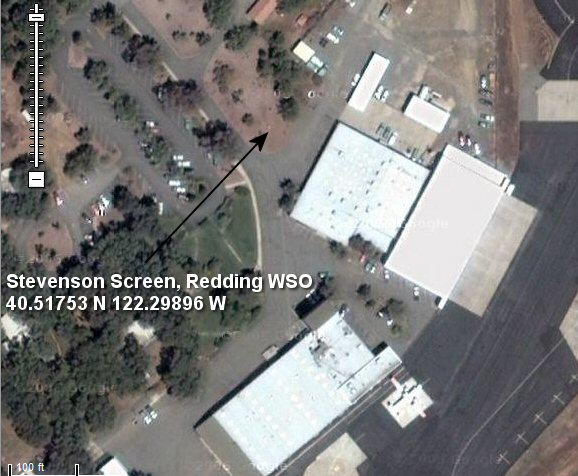
Redding, CA (lightbulb in temperature shelter, nearby asphalt and buildings, lots of airport tarmac)

More photos: http://gallery.surfacestations.org/main.php?g2_itemId=682
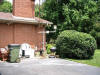
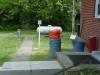
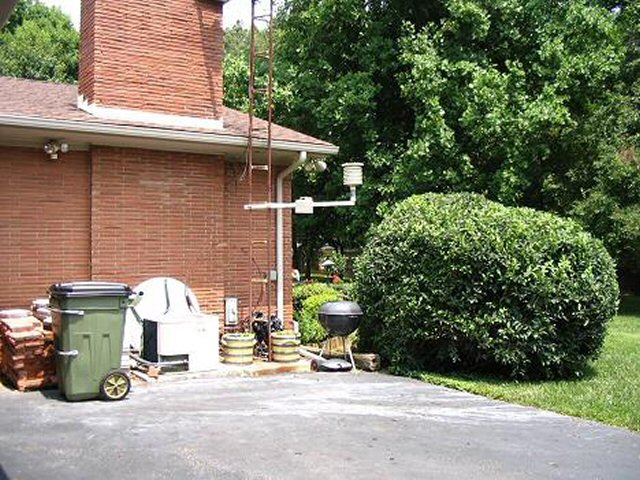
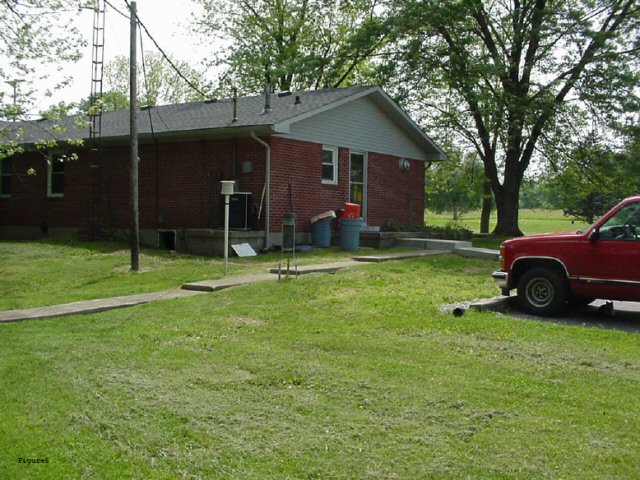
Hopkinsville, KY Picture at left is most current, others are from years ago. (MMTS sensor close to house, with air conditioning unit nearby, close-by parking, and near new fireplace chimney built into rear wall. Note BBQ also.)

13
posted on
08/12/2007 3:28:37 PM PDT
by
dennisw
To: dennisw
14
posted on
08/12/2007 3:30:22 PM PDT
by
Matchett-PI
(The 'RAT Party - Home of our most envious, hypocritical, and greedy citizens.)
To: dennisw
>>
Doesn’t someone check these to see if they are properly sited?
<<
IMO, for routine temperature measurements, the siting was not such a great issue. However, the entire environment of management of this program was not set up to have a uniform and consistent approach over long periods of time. There is the simple question of calibration standards and over time, how do you insure that a simple mercury thermometer in California maintains just as a reliable reading as one in Indiana manned by a volunteer?
Again, this would be almost inconsequential. Who cares if the high today is 81 or 82 degrees? Nobody involved in the design and running of this system over the past decades and even generations had the slightest idea that in the early part of the 21st century people would be trying to reinterpret data that is really plus or minus a few whole degrees for trends that are measured in tenths of degree.
It is just silly and that is exactly why, for example, Jon Daly’s web site (http://www.john-daly.com/) just drives advocates of Global Lukewarming nuts.
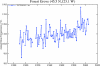
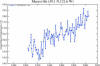
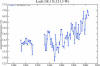
If warming is “global”, the effect should be visible in just about any dataset you pick. Yet, it is not.
On his “What Stations Say” page, he has some pairs of stations. In some cases, one station is subject to creeping urbanization, or as we now see, downright compromising erosion of its value as a site because of very local environmental factors, such as turning on a nearby air conditioner.
Daly passed away and that is the reason some charts stop too early.
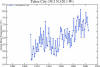
And example of a city-pair:
http://www.john-daly.com/stations/cherokee.gif
from the What Stations Say page at:
http://www.john-daly.com/stations/stations.htm
Now that Mark Steyn has written about the NOAA/NASA Thermometer-Gate scandal (the coverup is always worse than the original crime), I hope, but do not expect, all the MSM that echoed these alarms will acknowledge this gross error.
To: dennisw
To: Westlander
Oh my gosh, I just HAVE to have one of those custom Serpent River weather stations!
Seems to me that its no more subject to “interpretation” than any other type of weather station.
Of course, I’d have to have an eco friendly rock, say one made out of pure carbon?
17
posted on
08/12/2007 3:38:38 PM PDT
by
Carbonado
("Islame-ic radical" is a redundant term, just like "Leftist journalist")
To: dennisw; All
KEEP IN MIND FOLKS!!!!!!!!!!!!
THE SCANDAL IS NOT JUST THE LOCATION OF THE STATIONS!!!!
NASA TRIED TO CONCEAL THE DATA ABOUT THEIR LOCATIONS AND THEN CONCEALED THE DATA MANIPULATION!!!!
we need a “ “Gate name for this....Datagate?
18
posted on
08/12/2007 3:38:50 PM PDT
by
longtermmemmory
(VOTE! http://www.senate.gov and http://www.house.gov)
To: dennisw
LOL! As the road is periodically repaved with fresh black asphalt, the U of A will find that their local climate is cyclical, in a sawtooth pattern.
19
posted on
08/12/2007 3:41:22 PM PDT
by
FreePoster
(Duncan Hunter in 2008)
To: theBuckwheat
20
posted on
08/12/2007 3:46:36 PM PDT
by
dennisw
Navigation: use the links below to view more comments.
first 1-20, 21-40, 41-53 next last
Disclaimer:
Opinions posted on Free Republic are those of the individual
posters and do not necessarily represent the opinion of Free Republic or its
management. All materials posted herein are protected by copyright law and the
exemption for fair use of copyrighted works.
FreeRepublic.com is powered by software copyright 2000-2008 John Robinson


