Skip to comments.
D.C.'s Distinction: $16,344 Per Student, But Only 12% Read Proficiently
Human Events ^
| March 23 2006
Posted on 03/25/2006 11:20:28 AM PST by Reagan Man
The District of Columbia spends far more money per student in its public elementary and secondary schools each year than the tuition costs at many private elementary schools, or even college-preparatory secondary schools. Yet, District 8th-graders ranked dead last in 2005 in national reading and math tests.
D.C.'s public elementary and secondary schools spent a total of $16,334 per student in the 2002-2003 school year, according to a Department of Education study. That compares to the $10,520 tuition at St. John's College High School, a District Catholic school that sends almost all its graduates to four-year colleges.
Last year, however, only 12% of 8th-graders in the District's public schools scored at grade-level proficiency or better in reading in the federal National Assessment of Educational Progress tests that were administered in the District and all 50 states. Only 7% of the District's public-school 8th-graders scored grade-level proficiency or better in math.
Not one U.S. state can boast that a majority of the 8th-graders in its public schools last year had achieved grade-level proficiency or better in either reading or math.
How much money did your state spend per pupil while failing to adequately educate in reading and math the majority of students in its public schools? The answers are in the chart below.
They eloquently make the case for school choice.
The state spending figures below are the total median expenditure per student as reported in "Revenues and Expenditures by Public School Districts: School Year 2002-03," published by the Department of Education in November 2005. The NAEP 8th-grade reading and math scores were published by the Department of Education in October 2005.
| State |
Per Pupil Spending
|
Percentage of 8th-Graders at Proficiency or Better
in Reading |
Percentage of 8th-Graders at Proficiency or Better
in Math |
| Alaska |
$16,665
|
27%
|
29%
|
District of Columbia
|
$16,344
|
12%
|
7%
|
New York
|
$13,989
|
33%
|
31%
|
New Jersey
|
$12,419
|
37%
|
36%
|
Wyoming
|
$12,116
|
35% |
29%
|
Delaware
|
$10,874
|
31%
|
30%
|
Connecticut
|
$10,765
|
34%
|
35%
|
| New Mexico |
$10,602
|
19%
|
14%
|
Rhode Island
|
$10,189
|
29%
|
23%
|
Massachusetts
|
$9,952
|
44%
|
43%
|
| Wisconsin |
$9,805 |
34%
|
36%
|
Maine
|
$9,787
|
38%
|
30%
|
New Hampshire
|
$9,731
|
38%
|
35%
|
Vermont
|
$9,614
|
37%
|
38%
|
Maryland
|
$9,298
|
30% |
30% |
Pennsylvania
|
$9,298
|
36%
|
31%
|
Minnesota
|
$9,133
|
37%
|
43%
|
Colorado
|
$8,948
|
31%
|
32%
|
Montana
|
$8,927
|
37%
|
36%
|
West Virginia
|
$8,845
|
22%
|
17%
|
Texas
|
$8,826
|
26%
|
31%
|
| Nebraska |
$8,714
|
35%
|
35%
|
Indiana
|
$8,673
|
28%
|
30%
|
Michigan
|
$8,651
|
28%
|
30%
|
Hawaii
|
$8,632
|
18%
|
18%
|
Kansas
|
$8,620
|
34%
|
34%
|
Oregon
|
$8,577
|
33%
|
33%
|
North Dakota
|
$8,552
|
37%
|
35%
|
Illinois
|
$8,465
|
31%
|
28%
|
Nevada
|
$8,458 |
22%
|
21%
|
Washington
|
$8,454
|
34%
|
36%
|
Georgia
|
$8,393
|
24%
|
23%
|
California
|
$8,262
|
21%
|
22%
|
South Carolina
|
$8,226
|
25%
|
30%
|
Ohio
|
$8,208
|
24%
|
34%
|
Virginia
|
$8,087
|
35%
|
33%
|
South Dakota
|
$8,001
|
35%
|
36%
|
Iowa
|
$7,789
|
34%
|
34%
|
Florida
|
$7,571
|
25%
|
26%
|
Idaho
|
$7,554
|
32%
|
30%
|
North Carolina
|
$7,469
|
27%
|
32%
|
Missouri
|
$7,462
|
31%
|
26%
|
Louisiana
|
$7,443
|
20%
|
16%
|
Alabama
|
$6,942
|
22%
|
15%
|
Kentucky
|
$6,934
|
31% |
22%
|
Arizona
|
$6,933
|
23%
|
26%
|
Utah
|
$6,859
|
29%
|
30%
|
Oklahoma
|
$6,817
|
25%
|
20%
|
Arkansas
|
$6,774
|
26%
|
22%
|
Tennessee
|
$6,460
|
26%
|
21%
|
Mississippi
|
$6,387
|
19%
|
13%
|
TOPICS: Culture/Society; Government; News/Current Events; Politics/Elections
KEYWORDS: dc; education
Navigation: use the links below to view more comments.
first previous 1-20, 21-40, 41-60, 61-80, 81-89 next last
To: Reagan Man
Just another routine day on the corrupt democrat party controlled slave plantation known as the District of Columbia, utterly destroying children of color. The corruption of the democrat's D.C. teachers union is legendary.
And Hillary went positively berserk yesterday, when she was asked about school vouchers. Can't have these uppity blacks getting any real education. I doubt that one dollar in three ever makes it past the criminal entity of the democrat party to get to children in D.C.

21
posted on
03/25/2006 11:51:56 AM PST
by
FormerACLUmember
(No program, no ideas, no clue: The democrats!)
To: Clemenza
22
posted on
03/25/2006 11:58:37 AM PST
by
moog
To: FormerACLUmember
The evils of liberalism and social engineering continue to have a profound impact on America and her children. Cradle to grave liberal socialism doesn't work in our constitutional republic. The NEA is a communist organization more concerned with the well being of teachers, then with the students. America has lost ground in many aspects of basic education requirements. The three R`s have taken a severe hit from the PC crowd. In many ways our children are receiving a second rate education, that offers no diplomas, just a ticket to a back seat in life.
23
posted on
03/25/2006 12:03:47 PM PST
by
Reagan Man
(Secure our borders;punish employers who hire illegals;stop all welfare to illegals)
To: Reagan Man
Recognizing the differences, it's still painful to recognize the similarities.
24
posted on
03/25/2006 12:05:40 PM PST
by
DoughtyOne
(If you don't want to be lumped in with those who commit violence in your name, take steps to end it.)
To: SouthCarolinaKit
In most private schools the teachers are paid far less, the cost is far less and the kids learn far more. Still, studies are rampant at public schools to figure out what's wrong and fix it. LOL, the lab rats are out there if only they would take notice.
25
posted on
03/25/2006 12:07:43 PM PST
by
DoughtyOne
(If you don't want to be lumped in with those who commit violence in your name, take steps to end it.)
To: truemiester
These expenditure numbers are significantly understated. They do not include capital outlays for buildings and infrastructure. Here in North Carolina the total per pupil expenditure is over 10K. The state is growing quickly, so that number may not be proportionally representative of the entire nation, but the expenditures are still low-balled.
To: moog
The proficient grade level score means an ADVANCED grade level score while a basic grade level "mastery" score is in another category. Grade level mastery would include many more than this I concede that I was not taking into account the myriad ways the public school system has of pigeon-holing and nuancing.
Nonetheless, based on my dealings with the system, I suspect basic grade level "mastery" to be not even worth noting. One of the reasons I say that, is that 8th grade reading and math standards are in the gutter to begin with. Basic mastery of them means very little.
When I completed the 9th grade, I had easily mastered what are considered 12th grade standards now. With perhaps the exception of advanced math. No, I take that back. What was shown to me 6 years ago as advanced algebra at the local high school (well ranked, I should add), compared with my 9th grade algebra one.
In 1967, when I finished the 9th grade, I could have sleep walked through a contemporary senior year. Point being, that even "proficient" levels are pretty crappy.
To: Reagan Man
I agree that educational labor unions should be disallowed, that we spend far too much for education, and that our public schools are teaching the wrong subjects and inculcating the wrong values.
Except for the glaring differential in spending per student and results, the use of these "proficiency" statistics is quite misleading. If you go to the web site for this study, the latest student scores have been steady since 1970. It's not like they are going into the bucket over the last few years.
Here's a link to the web site:
http://nces.ed.gov/nationsreportcard/
Click on Long Term Trend, then click on Results of 2004, then click on Trends in Reading, then click on Average Scale Scores. (You can't get their with a direct link)
I may be wrong as I glanced over it quickly but I think this test's definition of "Proficiency" is the level achieved by an advanced or an A+ student in the grade 12.
It's appalling that DC school districts spent $16,000 per year for a student to achieve only 1/2 of the results of a student in Arkansas -- yet Arkansas only spent $6,700 per student per year.
There could not be a clearer case that increased money for school systems does not result increased school performance. We need more competition -- most likely through a system of vouchers.
To: Reagan Man
You can lead a student to a book, but you can't make him read.
29
posted on
03/25/2006 12:19:42 PM PST
by
dfwgator
To: ChildOfThe60s
Depends on the area somewhat. In some areas around here, they learn stuff that was much higher than we did way back when. Some of the 6th grade math stuff here I didn't get until 8th grade. I'm NOT generalizing for ALL areas though, just commenting on my own.
For example, I have seen in a few areas, that for first grade, they expect the kids to be on a basic reading level and to be able to write a construct a simple sentence. Here locally, they are often into chapter books and at least writing simple paragraphs.
To me basic mastery of language arts, for example, means being able to read on that grade level, comprehend on that grade level, and master the various grammar concepts for that level. It may be different for someone else.
30
posted on
03/25/2006 12:24:48 PM PST
by
moog
To: Hop A Long Cassidy
The answer, is obviously, tax the rich and spend more on DC schools.
/dumb democrat
31
posted on
03/25/2006 12:25:20 PM PST
by
Crazieman
(6-23-2005, Establishment of the United Socialist States of America)
To: ChildOfThe60s
You bring up a point when you talk about the nuancing. There are so many different ways people can look at statistics, particularly if there used in political ways.
I wouldn't support "stats" by the ACLU on religion for example (yes, I realize that is a little different than the ones here). For myself, I look at the things that happen around me and in my own environment to determine the best course HERE. Applied to other areas, it's different.
32
posted on
03/25/2006 12:27:37 PM PST
by
moog
To: Hop A Long Cassidy
Is this the right chart?

33
posted on
03/25/2006 12:28:40 PM PST
by
Reagan Man
(Secure our borders;punish employers who hire illegals;stop all welfare to illegals)
To: Reagan Man
I wonder what the levels are in alternate choice schools.
34
posted on
03/25/2006 12:34:05 PM PST
by
Exit148
(Founder of the Loose Change Club. Every nickle and dime counts!!)
To: Reagan Man
One out of four delegates to every Democrat Party National Convention is from a teacher's union, or married to a teacher!!
The last place on earth to look to save D.C. children or other minority children is the crooked rat party.
35
posted on
03/25/2006 12:39:35 PM PST
by
FormerACLUmember
(No program, no ideas, no clue: The democrats!)
To: Exit148
My thought exactly.
With home schooling and private schools membership growing in recent years, I'd say its likely their scores are higher and a factor in why theres been no drop off in overall scores.
36
posted on
03/25/2006 12:39:49 PM PST
by
Reagan Man
(Secure our borders;punish employers who hire illegals;stop all welfare to illegals)
To: Reagan Man
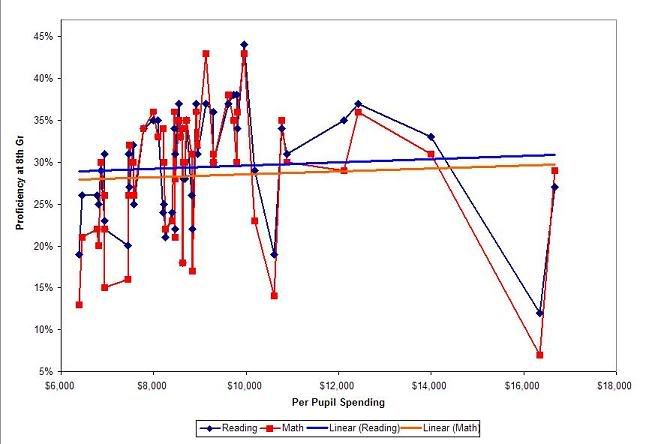
This just demands a plot!
37
posted on
03/25/2006 1:02:38 PM PST
by
burzum
(A single reprimand does more for a man of intelligence than a hundred lashes for a fool.--Prov 17:10)
To: Reagan Man
Interesting article, but it doesn't really tell me much. Where is the money going? For instance, Alaska tops the list, but is all that spending in the same areas as DC? I would imagine that Alaska has much higher transporation costs thank DC does.
Money spent per student isn't a persuasive argument, anyway. What are we getting for the money? I'd wager that taxpayers in Alaska get a lot more bang for their educational buck than DC residents do.
Then again, look at Mississippi. They rank 48th on this list, and they spend the least as well. Is that a case of "you get what you pay for"? What does Massachusetts know that nobody else has figured out yet? Their spending is among the highest (42nd), and their scores are #1. And the Massholes getting their money's worth in education?
Don't get me wrong; the District of Columbia is a disgrace. But I'm more interested in what the problem is. All this study tells me is that the problem isn't (spending). You can't look at the table you posted and draw any conclusion about the relationship between per-pupil spending and learning.
38
posted on
03/25/2006 1:07:46 PM PST
by
Doohickey
(Democrats are nothing without a constituency of victims.)
To: burzum
It appears that spending more actually does improve proficiency! If you are willing to spend $10k more per student you can get a whopping 2% more proficiency! Think what would happen if we spent another $100k! 20%! Heck if we only spend an additional $350,000 per student per year we can have total proficiency!
(Disclaimer: of course its not perfectly linear)
39
posted on
03/25/2006 1:09:32 PM PST
by
burzum
(A single reprimand does more for a man of intelligence than a hundred lashes for a fool.--Prov 17:10)
To: Reagan Man
Shortly before the Soviet Union invaded Afghanistan in the late 70's it produced a very slick propaganda history of WWII on the Eastern Front, narrated by the late Burt Lancaster, a closet Communist. The NEA endorsed that movie as an "educational" film.
Navigation: use the links below to view more comments.
first previous 1-20, 21-40, 41-60, 61-80, 81-89 next last
Disclaimer:
Opinions posted on Free Republic are those of the individual
posters and do not necessarily represent the opinion of Free Republic or its
management. All materials posted herein are protected by copyright law and the
exemption for fair use of copyrighted works.
FreeRepublic.com is powered by software copyright 2000-2008 John Robinson