Skip to comments.
Ice Is Melting Everywhere
Environment News Service ^
| February 25, 2005
| Danielle Murray
Posted on 02/25/2005 4:03:38 PM PST by Willie Green
For education and discussion only. Not for commercial use.
WASHINGTON, DC, February 25, 2005 (ENS) - Ice is melting everywhere - and at an accelerating rate. Rising global temperatures are lengthening melting seasons, thawing frozen ground, and thinning ice caps and glaciers that in some cases have existed for millennia. These changes are raising sea level faster than earlier projected by scientists, and threatening both human and wildlife populations.
Since the industrial revolution, human activity has released ever-increasing amounts of carbon dioxide and other greenhouses gases into the atmosphere, leading to gradual but unmistakable changes in climate throughout the world - especially at the higher latitudes.
Average surface temperatures in the Arctic Circle have risen by more than half a degree Celsius (0.9 degrees Fahrenheit) per decade since 1981.
The extent of Arctic sea ice cover has decreased by 7–9 percent per decade.
And the three smallest extents of summer ice ever seen there have all occurred since 2002. According to the latest forecasts, the Arctic could be ice-free in the summer by the end of this century.
The Arctic melt season has lengthened by 10–17 days, shrinking the amount of ice buildup that remains from year to year. As sea ice thins and recedes from coastlines, indigenous hunters and fishers are finding themselves cut off from traditional hunting grounds.
Coastal communities face more violent and less predictable weather, rising sea levels, and diminishing access to food sources. Polar bears, unable to cross thin or nonexistent ice to hunt seals, will soon face a severely reduced food source.
Scientists fear that with continued melting, the bears may become extinct by the end of the century. Seals, walruses, and seabirds will also lose key feeding and breeding grounds along the ice edge.
Marine transport through the Arctic is expected to increase as ice melts and new shipping routes become available. The length of the navigation season along the Northern Sea Route is projected to increase to about 120 days by 2100, up from the current 20–30 days. While this could have positive economic effects, some observers worry about the environmental costs that might accompany increased ship access to Arctic waters, such as oil spills and fishery depletion.
Arctic permafrost has warmed by up to 2 degrees Celsius in recent decades, with soils thawing to greater depths. By the end of this century, the southern permafrost boundary is projected to shift northward by several hundred kilometers, changing regional vegetation patterns.
An estimated 15 percent of the Arctic tundra has already been lost since the 1970s - an area roughly three times the size of California. As permafrost thaws, unstable ground shifts or subsides, damaging buildings, roads, pipelines, and other infrastructure in areas such as Alaska and Siberia.
The Greenland ice sheet is the largest land ice mass in the Northern Hemisphere. It holds enough fresh water to raise the earth´s sea level by 7.2 meters (24 feet) if it were to melt completely, a result expected if the regional temperature rises 3 degrees Celsius.
Scientists project that concentrations of greenhouse gases will be high enough by 2100 to push temperatures past this threshold. Satellite data show Greenland´s ice has been melting at higher and higher elevations every year since 1979.
A conservative estimate of annual ice loss from Greenland is 50 cubic kilometers (12 cubic miles) per year, enough water to raise the global sea level by 0.13 millimeters a year.
The Amundsen Sea region in the West Antarctic has experienced some of the world´s greatest temperature change, with annual temperatures up 2.5 degrees Celsius over the past 60 years. The glaciers flowing into the sea from the Antarctic continent have been getting thinner for the past 15 years, and ice shelves in the region have decreased by more than 13,500 square kilometers since the 1970s.
Since the collapse of the Delaware-sized Larsen B Ice Shelf in 2002, satellites have shown a two to sixfold increase in the speed of glaciers flowing toward the former ice shelf. While most glaciers typically move a few centimeters to several hundred meters annually, these glaciers are currently moving as much as 1.5 kilometers each year.
This type of acceleration has been witnessed throughout Antarctica and Greenland when ice shelves collapse, removing the barrier to the sea for interior glaciers and quickening the rate of fresh water loss to the ocean.
Glaciers in West Antarctica are discharging about 250 cubic kilometers of ice and water into the ocean per year, 60 percent more than is accumulated in their catchment areas - a net change sufficient to raise global sea levels by more than 0.2 millimeters per year.
Ice melting is not limited to the poles. According to glaciologist Lonnie Thompson of Ohio State University, all but 13 of the 2,000 glaciers in southeast Alaska are retreating. Montana´s Glacier National Park may have no glaciers left by 2030, and the ice cap on Tanzania´s Kilimanjaro may disappear completely by 2015.
In South America, Andean glaciers have been melting three times faster in recent years than they were in the mid-twentieth century. Bolivia´s Chacaltaya, once home to the world´s highest ski slope, is estimated to be a mere 2 percent of its former size. It lost two-thirds of its mass in the 1990s alone and may disappear completely by 2010.
Shrinking glaciers may mean a loss of power in Peru, where 70 percent of electricity comes from hydroelectric turbines powered by the annual runoff from glaciers.
In fact, millions of people living in Asia and South America rely on glacial runoff for drinking water and irrigation. If the glaciers disappear, severe water shortages are sure to follow. Meanwhile, rapidly filling glacial lakes in both the Andes and Himalayas threaten to break their banks and flood towns below.
In Europe, shrinking glaciers and snow cover in the Alps are undermining the continent´s ski and tourism industries. By 2025, Alpine glaciers are likely to contain only half their 1970s volume, dwindling to five percent by the end of the century. Pollution from European cities does not help the situation: scientists have measured black carbon concentrations atop these mountains high enough to double the area´s absorption of sunlight.
Such widespread glacial melting has local as well as global effects. Global sea level has risen 10–20 centimeters in the past century. According to the Intergovernmental Panel on Climate Change, up to 1 meter of sea level rise is projected by 2100, with half the rise attributed to melting ice and half to thermal expansion. As sea level rises, inundation and loss of coastal land will force millions of people to relocate.
Warming and melting could force local plant and animal species to adapt or relocate - an increasingly difficult proposition as wildlife habitats are fragmented by expanding human populations. Changes to the food base of ecosystems, such as decreases of algae and plankton in the Arctic Ocean, could have a ripple effect all the way up to the top predators, including the people who hunt and fish these animals.
Most disturbing, many of the effects of ice melting are self-reinforcing. As ice disappears, land and open water are exposed. When sunlight strikes ice and snow, approximately 80 percent is reflected back into space and 20 percent is absorbed as heat. The opposite holds true for land and open water - 20 percent is reflected and 80 percent is absorbed.
This decrease in reflectivity, or albedo, creates a positive feedback loop, perpetuating the temperature rise and ice melting. Additionally, soot from faraway sources has darkened snow and ice, further decreasing albedo.
Melt water on top of glaciers and ice sheets contributes to fracturing and destabilization of the ice masses and increases flow rates as the water lubricates the underside of the ice. Thawing tundra releases trapped carbon dioxide and methane from newly created wetlands, contributing to further warming.
Finally, increased fresh water from melting glaciers and sea ice could alter ocean circulation patterns and destabilize regional climate patterns, perhaps weakening the Gulf Stream and North Atlantic currents that moderate Europe´s climate. Warmer waters may also decrease the ocean´s ability to act as a carbon sink. If no action is taken to halt global warming, these positive feedbacks could quickly send climate change spiraling out of control.
Melting ice is a harbinger of more change to come. Perhaps in the future, children will look back on the fabled polar bears of the icy North Pole the way we imagine woolly mammoths in the last Ice Age. Only this time, we will know who is to blame.
TOPICS: Culture/Society; News/Current Events
KEYWORDS: antarctica; climatechange; globalwarming; globalwarminghoax; junkscience; springthaw
Navigation: use the links below to view more comments.
first previous 1-20 ... 61-80, 81-100, 101-120 ... 141-142 next last
To: Willie Green
MORE>>>>>>>>>>>>>
************************************************
Solar Activity and Terrestrial Climate
(28 July 04) updated (30 July 04)
On July 6, 2004, a BBC article, headlined Sunspots reaching 1000-year high, caught the attention of a number of readers. Related articles soon appeared in other publications, for example: Suspot activity hits 1000-year high at Swissinfo.org, The truth about global warming - it's the Sun that's to blame at the London Telegraph, and Hotter-burning sun warming the planet at the Washington Times.
It seems that at a conference of astronomers in Hamburg, Germany, Sami Solanki and colleagues presented a discussion of possible correlations between solar variability and terrestrial climate. The recent articles provide some clues to the content of the presentation, but a slightly closer look may be of interest.
Interestingly enough, the principal paper on which the presentation was based was published last year, and briefly discussed here by John Daly at Evidence for an Unusually Active Sun. An abstract of the paper is available at Millennium-Scale Sunspot Number Reconstruction: Evidence for an Unusually Active Sun since the 1940s. The paper is available in PDF form at I.G. Usoskin, S. Solanki, M. Schuessler, K. Mursula, K. Alanko, A millennium scale sunspot number reconstruction: Evidence for an unusually active sun since the 1940's, Phys. Rev. Lett., 91(21), 211101, 2003. (Hereinafter, Usoskin et al. 2003)
Of several closely related papers I will mention I.G.Usoskin, K. Mursula, S. Solanki, M. Schuessler, and K. Alanko, Reconstruction of solar activity for the last millennium using 10Be data, Astron. Astrophys., 413, 745-751, 2004.. (Hereinafter, Usoskin et al. 2004)
Using records of 10Be (Beryllium 10) concentration in polar ice, and some physical models for processes connecting 10Be concentration with sunspot numbers, the authors attempt to reconstruct average sunspot numbers for the period from the year 850 to the present. Their reconstruction indicates that the period of high solar activity during the last 60 years is unique throughout the past 1150 years.
The 10Be records they use include annual data from Greenland for the years 1424 to 1985, and eight year sampled data from Antarctica for the years 850 to 1900. They supplement those data with some 14C (Carbon 14) data, apparently for most of the period of the study, and with group sunspot numbers (GSN) from 1610 on. While their methodology has its problems, they claim it results in a better correlation of 11 year smoothed "reconstructed" sunspot numbers with historical GSN than a statistical regression would do, and they summarize their results in a graph that includes indicators of MM: Medieval maximum, Om: Oort Minimum, Wm: Wolf minimum, Sm: Spörer minimum, Mm: Maunder minimum, and Dm: Dalton minimum. It also includes estimated corrections of their calculated sunspot numbers in the solid red and green lines.
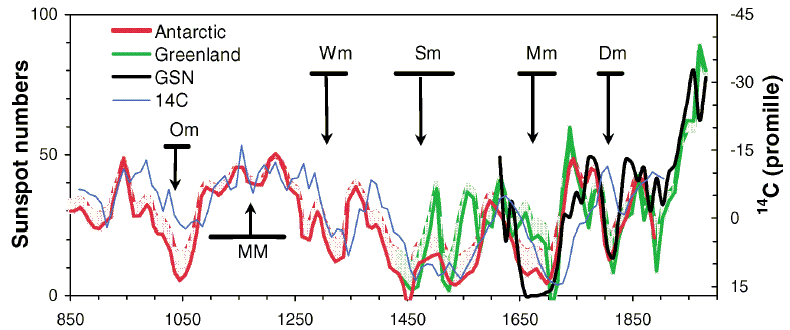
Figure 2 from Usoskin et al. 2003
You can readily notice various differences between their Greenland and Antarctic results, as well as between either of those and GSN, particularly during the Maunder minimum. These, and some other difficulties, are briefly discussed in Usoskin et al. 2003.
Of the presentation in Hamburg there is available a file of slides, Solar Activity over the last 1150 years: does it correlate with Climate?. Among those slides is the above graph, as well as several other graphs not included in Usoskin et al. 2003. Among the latter are two on a slide labelled: Comparison: Sunspot number & Climate.
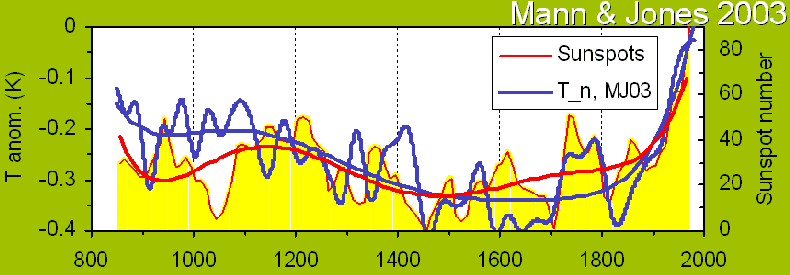

The next slide from the presentation offers
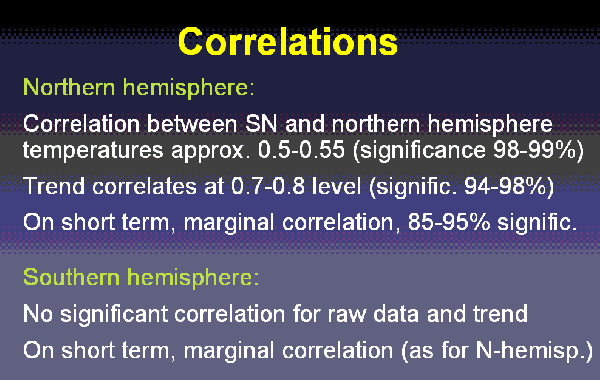
I would guess that the trend that correlates at 0.7-0.8 level is somehow related to the very smooth lines that run through each of those two graphs, including the sunspot lines that continue climbing right through the Maunder minimum. If their models cannot get more realistic about a phenomenon such as the Maunder minimum, they would seem to need much more work before asking people to take their climate correlations seriously. I suspect that one can find a variety of statistical trends that appear to correlate incidental aspects of phenomena. As displayed in the presentation, the proffered trend seems to me to be a distraction from identifying correlations based on physical causation.
A subsequent slide of the presentation asserts SN runs ahead of climate by 10 years (SN presumably being their calculated sunspot numbers). I can imagine various lead times between sunspot numbers and various climatic effects, but I cannot see a 10 year lead time in either of those two graphs. (If you can, please let me know.)
While Usoskin et al. 2003 and related papers, including their difficulties, seem to me to be quite interesting, it also seems to me that the attempt in the presentation to portray a correlation with either version of the hockey stick, much less with both versions, was not conducive to resolving any of the difficulties.
Some incidental comments: Usoskin et al. 2003, and the presentation, emphasize the very much higher sunspot numbers in recent years than in earlier years, even within the historical series of group sunspot numbers. I estimate that the 11 year smoothed GSN of 1959 is about 57 per cent higher than that of 1790, which by my calculations was the highest before 1935. However, using Wolf sunspot numbers (WSN), the 11 year smoothed sunspot number for 1959 seems to be only about 20 per cent higher than that of 1790. Still higher, but not as strikingly so. The next two graphs present annual, and 11 year smoothed, comparisons between numbers based on each of the systems.
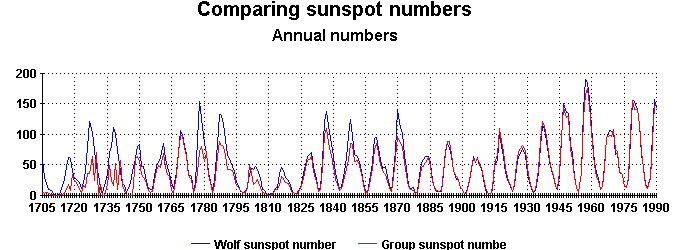
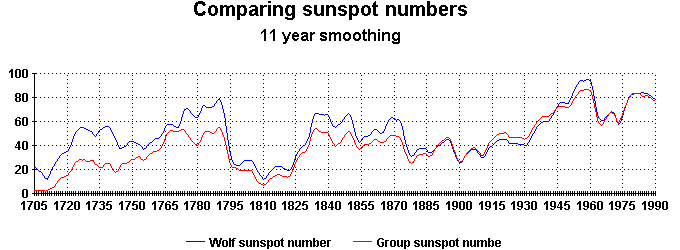
(Data for these two graphs are from: GSN and WSN ).
I am not aware of the relative merits of the two numbering systems. One obvious advantage of GSN is that they extend back to 1610, while WSN extend back only to about 1700, and some might suggest only to about 1750.
Update added 30 July 2004
A recent UPI article, Climate: The Vanishing Solar Factor, has been added to the mix. I will comment briefly on just a couple of parts of it. In order for the sun to force the climate to the little ice age observed during the Maunder Minimum, the change in the solar constant had to be about twice what has been observed during modern, zero-sunspot periods.
1. Modern zero-sunspot periods have been very brief. The most recent calendar month with a zero WSN was June 1913; the most recent calendar year with a zero WSN was 1810. A zero sunspot day, or week, may not tell us much about what the so-called solar constant would do during a zero sunspot year, or a zero sunspot decade.
2. The statement implies an assumption that variations of solar wind and the magnetic heliosphere, and variations of the flux of cosmic rays, have no climatic effects, but without addressing research results indicating that they do. Raimund Muscheler probably could direct the author of the article to some of that research.
In the 2002 Harold Jeffreys Lecture to the Royal Astronomical Society in London, Solanki said: After 1980, however, the Earth's temperature exhibits a remarkably steep rise, while the sun's irradiance displays at the most a weak secular trend. Hence the sun cannot be the dominant source of this latest temperature increase, with man-made greenhouse gases being the likely dominant alternative.
1. That statement suggests that Solanki had not yet read Usoskin et al. 2003, which he co-authored. :-) Again, solar irradiance is not the only solar variable.
2. If the "latest temperature increase" refers to a globally averaged surface temperature increase which allegedly exceeds lower free troposphere temperature changes, then it refutes, rather than supports, notions of greehouse gases being a plausible, much less a likely dominant, alternative.
81
posted on
02/25/2005 6:38:08 PM PST
by
Ernest_at_the_Beach
(This tagline no longer operative....floated away in the flood of 2005 ,)
To: Willie Green
Yet more junk science to waste FR bandwidth...
82
posted on
02/25/2005 6:42:49 PM PST
by
TheBattman
(Islam (and liberals)- the cult of Satan)
To: Boot Hill; snopercod; Carry_Okie; RadioAstronomer; NormsRevenge; Grampa Dave; SierraWasp; blam; ...
Weather discussion and all manner of technical stuff with the latest Global Warming argument.
83
posted on
02/25/2005 6:51:30 PM PST
by
Ernest_at_the_Beach
(This tagline no longer operative....floated away in the flood of 2005 ,)
To: Ernest_at_the_Beach
There is so much information on climate change that it is hard to sort through it all.
To: UCANSEE2
Aren't these icebergs from the recent shelf breakage, and then the Rhode Island size berg crashed back into the next section of shelf, fracturing it into calves each several miles across, and numbering in the 100's?????I haven't been down there to check!
85
posted on
02/25/2005 6:56:27 PM PST
by
Ernest_at_the_Beach
(This tagline no longer operative....floated away in the flood of 2005 ,)
To: Libertarianize the GOP; pfony1; MHalblaub; Einigkeit_Recht_Freiheit; A Balrog of Morgoth; ...
Yes, but we are being bombarded by highly selective media pieces such as what Willie posted here, so I am throwing the Kitchen Sink back at it!
86
posted on
02/25/2005 7:00:28 PM PST
by
Ernest_at_the_Beach
(This tagline no longer operative....floated away in the flood of 2005 ,)
To: Ernest_at_the_Beach
That's really good info you've been posting.
And it was timely too, because I just finished downloading a quarter million data points from the National Solar Radiation Data Base. They have been collecting data from 239 sites around the nation since before 1960. I've been analyzing the data on Excel and found something very interesting in their data. Over the last 30 years the amount of both direct and diffuse solar radiation reaching the earth, has declined about 10%.
Since solar radiation is the single biggest input to the climatologically algorithm, that's really a stunning 30 year change with major implications about climate change! This change is so large that I'm wondering whether the data they collected is real or whether the instrumentation was faulty or whether the data was "modeled" in some undisclosed manner. I've read both of the DOE manuals on how this data was collected and how it is applied, and I've found nothing that can explain so large a change.
--Boot Hill
87
posted on
02/25/2005 7:46:07 PM PST
by
Boot Hill
("...and Josuha went unto him and said: art thou for us, or for our adversaries?")
To: Boot Hill; Libertarianize the GOP
Damn!
a quarter million data points.....
88
posted on
02/25/2005 7:48:30 PM PST
by
Ernest_at_the_Beach
(This tagline no longer operative....floated away in the flood of 2005 ,)
To: Boot Hill; Libertarianize the GOP
89
posted on
02/25/2005 7:54:51 PM PST
by
Ernest_at_the_Beach
(This tagline no longer operative....floated away in the flood of 2005 ,)
To: Ernest_at_the_Beach
"Damn! a quarter million data points....."
Yeah, had to be done page-by-page, took me several days, I think I need a new mouse. I'm glad that part's over!
--Boot Hill
90
posted on
02/25/2005 7:56:34 PM PST
by
Boot Hill
("...and Josuha went unto him and said: art thou for us, or for our adversaries?")
To: Boot Hill
91
posted on
02/25/2005 8:20:09 PM PST
by
Ernest_at_the_Beach
(This tagline no longer operative....floated away in the flood of 2005 ,)
To: rock58seg
It is the inclination, the procession of the equinoxes, and the elliptical orbit in combination that give one more, one less, sun.
Or, did you have some other reason the southern ice cap is larger?
92
posted on
02/25/2005 8:35:43 PM PST
by
UCANSEE2
To: UCANSEE2
"procession,precession, whatever."
93
posted on
02/25/2005 8:37:25 PM PST
by
UCANSEE2
To: Willie Green
I'm confused. Are they saying that has risen above 32degrees in the poles? Cause I don't think there is a 'little ice' and 'lotsa ice' temperatures. It's either freezing or it's not.
94
posted on
02/25/2005 8:42:21 PM PST
by
sandbar
To: Willie Green
OK: Title of this piece is
Ice Is Melting Everywhere
Evidence to the contrary comes from :
Temperature in Antarctica By Jack .J Daly
*********************************************
Temperature in Antarctica By Jack .J Daly
|
Vostok Going Nowhere (9th Jan 04) Vostok is a scientific base in Antarctica that holds the world record of the coldest place on the face of the Earth. Vostok is positioned in the highest point in Antarctica, it sits on 4km if ice and a large lake is concealed beneath it. Environmentalists say: by the year 2050 the ice in Antarctic will begin to melt and sea-levels will rise and by that they imply that some seaports would submerge in a extra meter of sea-level rise, the Netherlands's and London will go too. And you can call Venice, Atlantis from now on. According to this chart the Annual Temperature is Between - 60° and - 50° ("Oh Global Warming", again). Even Summers are between - 40° and - 30° (Scorching Hot). Winters can reach up to - 70° (A Heat Wave). The temperature is getting nowhere and that means there isn't Global Warming hear. |
|
 For many more charts see the link... |
95
posted on
02/25/2005 8:42:48 PM PST
by
Ernest_at_the_Beach
(This tagline no longer operative....floated away in the flood of 2005 ,)
To: Ernest_at_the_Beach
I haven't been down there to check!Thanks, I needed that.
96
posted on
02/25/2005 8:46:32 PM PST
by
UCANSEE2
To: Ernest_at_the_Beach
Dang, boy, you don't just fool around!
97
posted on
02/25/2005 8:47:35 PM PST
by
UCANSEE2
To: Ernest_at_the_Beach
"Glaciers are growing around the world, including the United States"
I have some growing in my refrigerator, right now.
98
posted on
02/25/2005 8:49:02 PM PST
by
UCANSEE2
To: Willie Green
OK, article says this:
These changes are raising sea level faster than earlier projected by scientists,
Photo of Sea Level Change:
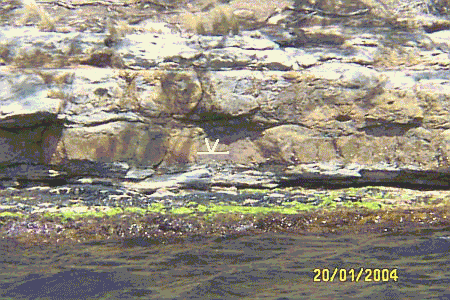
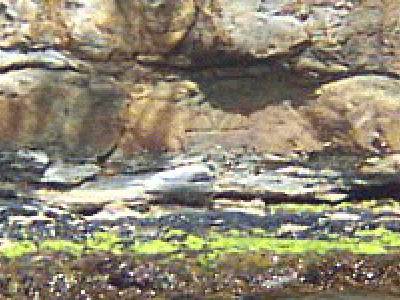
he 1841 sea level benchmark (centre) on the `Isle of the Dead', Tasmania. According to Antarctic explorer, Capt. Sir James Clark Ross, it marked mean sea level in 1841. Photo taken at low tide 20 Jan 2004. Mark is 50 cm across; tidal range is less than a metre.
AND WE SEE NO CHANGE
99
posted on
02/25/2005 8:49:05 PM PST
by
Ernest_at_the_Beach
(This tagline no longer operative....floated away in the flood of 2005 ,)
To: Willie Green
100
posted on
02/25/2005 8:49:58 PM PST
by
Havoc
(Reagan was right and so was McKinley. Down with free trade. Hang the traitors high)
Navigation: use the links below to view more comments.
first previous 1-20 ... 61-80, 81-100, 101-120 ... 141-142 next last
Disclaimer:
Opinions posted on Free Republic are those of the individual
posters and do not necessarily represent the opinion of Free Republic or its
management. All materials posted herein are protected by copyright law and the
exemption for fair use of copyrighted works.
FreeRepublic.com is powered by software copyright 2000-2008 John Robinson


