************************************************
Solar Activity and Terrestrial Climate
(28 July 04) updated (30 July 04)
On July 6, 2004, a BBC article, headlined Sunspots reaching 1000-year high, caught the attention of a number of readers. Related articles soon appeared in other publications, for example: Suspot activity hits 1000-year high at Swissinfo.org, The truth about global warming - it's the Sun that's to blame at the London Telegraph, and Hotter-burning sun warming the planet at the Washington Times.
It seems that at a conference of astronomers in Hamburg, Germany, Sami Solanki and colleagues presented a discussion of possible correlations between solar variability and terrestrial climate. The recent articles provide some clues to the content of the presentation, but a slightly closer look may be of interest.
Interestingly enough, the principal paper on which the presentation was based was published last year, and briefly discussed here by John Daly at Evidence for an Unusually Active Sun. An abstract of the paper is available at Millennium-Scale Sunspot Number Reconstruction: Evidence for an Unusually Active Sun since the 1940s. The paper is available in PDF form at I.G. Usoskin, S. Solanki, M. Schuessler, K. Mursula, K. Alanko, A millennium scale sunspot number reconstruction: Evidence for an unusually active sun since the 1940's, Phys. Rev. Lett., 91(21), 211101, 2003. (Hereinafter, Usoskin et al. 2003)
Of several closely related papers I will mention I.G.Usoskin, K. Mursula, S. Solanki, M. Schuessler, and K. Alanko, Reconstruction of solar activity for the last millennium using 10Be data, Astron. Astrophys., 413, 745-751, 2004.. (Hereinafter, Usoskin et al. 2004)
Using records of 10Be (Beryllium 10) concentration in polar ice, and some physical models for processes connecting 10Be concentration with sunspot numbers, the authors attempt to reconstruct average sunspot numbers for the period from the year 850 to the present. Their reconstruction indicates that the period of high solar activity during the last 60 years is unique throughout the past 1150 years.
The 10Be records they use include annual data from Greenland for the years 1424 to 1985, and eight year sampled data from Antarctica for the years 850 to 1900. They supplement those data with some 14C (Carbon 14) data, apparently for most of the period of the study, and with group sunspot numbers (GSN) from 1610 on. While their methodology has its problems, they claim it results in a better correlation of 11 year smoothed "reconstructed" sunspot numbers with historical GSN than a statistical regression would do, and they summarize their results in a graph that includes indicators of MM: Medieval maximum, Om: Oort Minimum, Wm: Wolf minimum, Sm: Spörer minimum, Mm: Maunder minimum, and Dm: Dalton minimum. It also includes estimated corrections of their calculated sunspot numbers in the solid red and green lines.
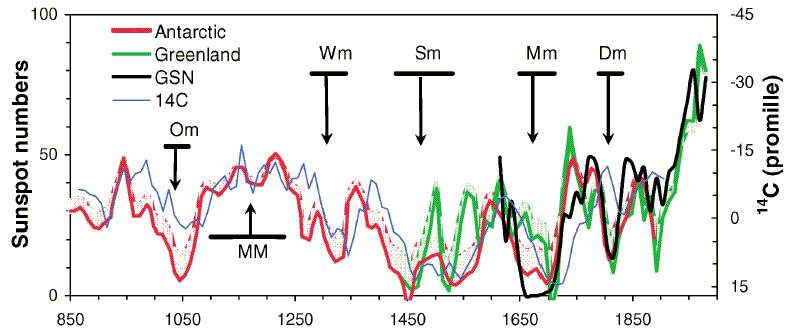
You can readily notice various differences between their Greenland and Antarctic results, as well as between either of those and GSN, particularly during the Maunder minimum. These, and some other difficulties, are briefly discussed in Usoskin et al. 2003.
Of the presentation in Hamburg there is available a file of slides, Solar Activity over the last 1150 years: does it correlate with Climate?. Among those slides is the above graph, as well as several other graphs not included in Usoskin et al. 2003. Among the latter are two on a slide labelled: Comparison: Sunspot number & Climate.
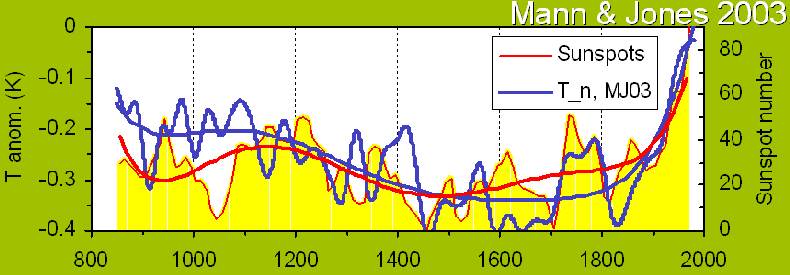

The next slide from the presentation offers
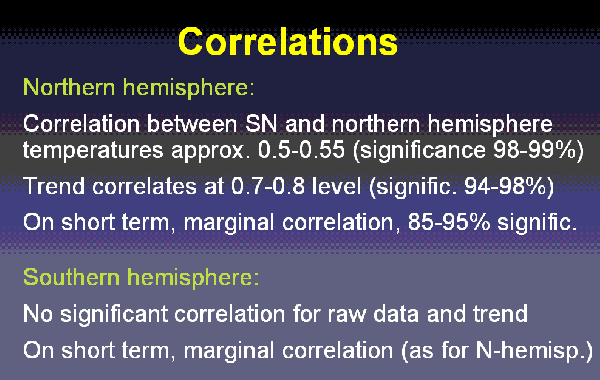
I would guess that the trend that correlates at 0.7-0.8 level is somehow related to the very smooth lines that run through each of those two graphs, including the sunspot lines that continue climbing right through the Maunder minimum. If their models cannot get more realistic about a phenomenon such as the Maunder minimum, they would seem to need much more work before asking people to take their climate correlations seriously. I suspect that one can find a variety of statistical trends that appear to correlate incidental aspects of phenomena. As displayed in the presentation, the proffered trend seems to me to be a distraction from identifying correlations based on physical causation.
A subsequent slide of the presentation asserts SN runs ahead of climate by 10 years (SN presumably being their calculated sunspot numbers). I can imagine various lead times between sunspot numbers and various climatic effects, but I cannot see a 10 year lead time in either of those two graphs. (If you can, please let me know.)
While Usoskin et al. 2003 and related papers, including their difficulties, seem to me to be quite interesting, it also seems to me that the attempt in the presentation to portray a correlation with either version of the hockey stick, much less with both versions, was not conducive to resolving any of the difficulties.
Some incidental comments: Usoskin et al. 2003, and the presentation, emphasize the very much higher sunspot numbers in recent years than in earlier years, even within the historical series of group sunspot numbers. I estimate that the 11 year smoothed GSN of 1959 is about 57 per cent higher than that of 1790, which by my calculations was the highest before 1935. However, using Wolf sunspot numbers (WSN), the 11 year smoothed sunspot number for 1959 seems to be only about 20 per cent higher than that of 1790. Still higher, but not as strikingly so. The next two graphs present annual, and 11 year smoothed, comparisons between numbers based on each of the systems.
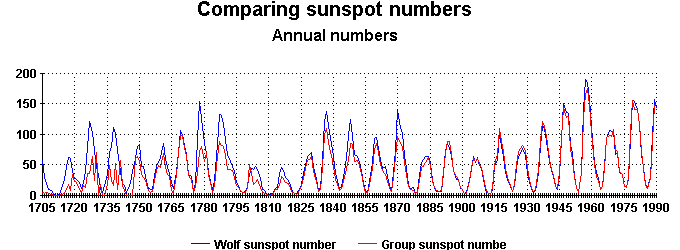
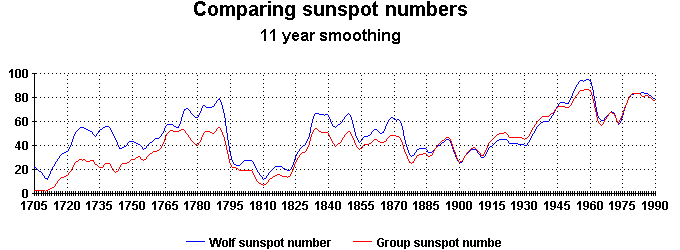
(Data for these two graphs are from: GSN and WSN ).
I am not aware of the relative merits of the two numbering systems. One obvious advantage of GSN is that they extend back to 1610, while WSN extend back only to about 1700, and some might suggest only to about 1750.
Update added 30 July 2004
A recent UPI article, Climate: The Vanishing Solar Factor, has been added to the mix. I will comment briefly on just a couple of parts of it.
In order for the sun to force the climate to the little ice age observed during the Maunder Minimum, the change in the solar constant had to be about twice what has been observed during modern, zero-sunspot periods.1. Modern zero-sunspot periods have been very brief. The most recent calendar month with a zero WSN was June 1913; the most recent calendar year with a zero WSN was 1810. A zero sunspot day, or week, may not tell us much about what the so-called solar constant would do during a zero sunspot year, or a zero sunspot decade.
2. The statement implies an assumption that variations of solar wind and the magnetic heliosphere, and variations of the flux of cosmic rays, have no climatic effects, but without addressing research results indicating that they do. Raimund Muscheler probably could direct the author of the article to some of that research.
In the 2002 Harold Jeffreys Lecture to the Royal Astronomical Society in London, Solanki said: After 1980, however, the Earth's temperature exhibits a remarkably steep rise, while the sun's irradiance displays at the most a weak secular trend. Hence the sun cannot be the dominant source of this latest temperature increase, with man-made greenhouse gases being the likely dominant alternative.1. That statement suggests that Solanki had not yet read Usoskin et al. 2003, which he co-authored. :-) Again, solar irradiance is not the only solar variable.
2. If the "latest temperature increase" refers to a globally averaged surface temperature increase which allegedly exceeds lower free troposphere temperature changes, then it refutes, rather than supports, notions of greehouse gases being a plausible, much less a likely dominant, alternative.