Or this:
“Yes, when focusing strictly on murders where the offender’s race is known (according to the FBI’s 2024 Expanded Homicide Data), Black or African American offenders accounted for 56.4% of those cases. That is a majority of the known-offender subset. White offenders were 40.8%, and other races were 2.7%”
So Furry goes searching for the white guy.
In spite of the MASSIVE BLACK CRIMINAL VIOLENCE RATES.
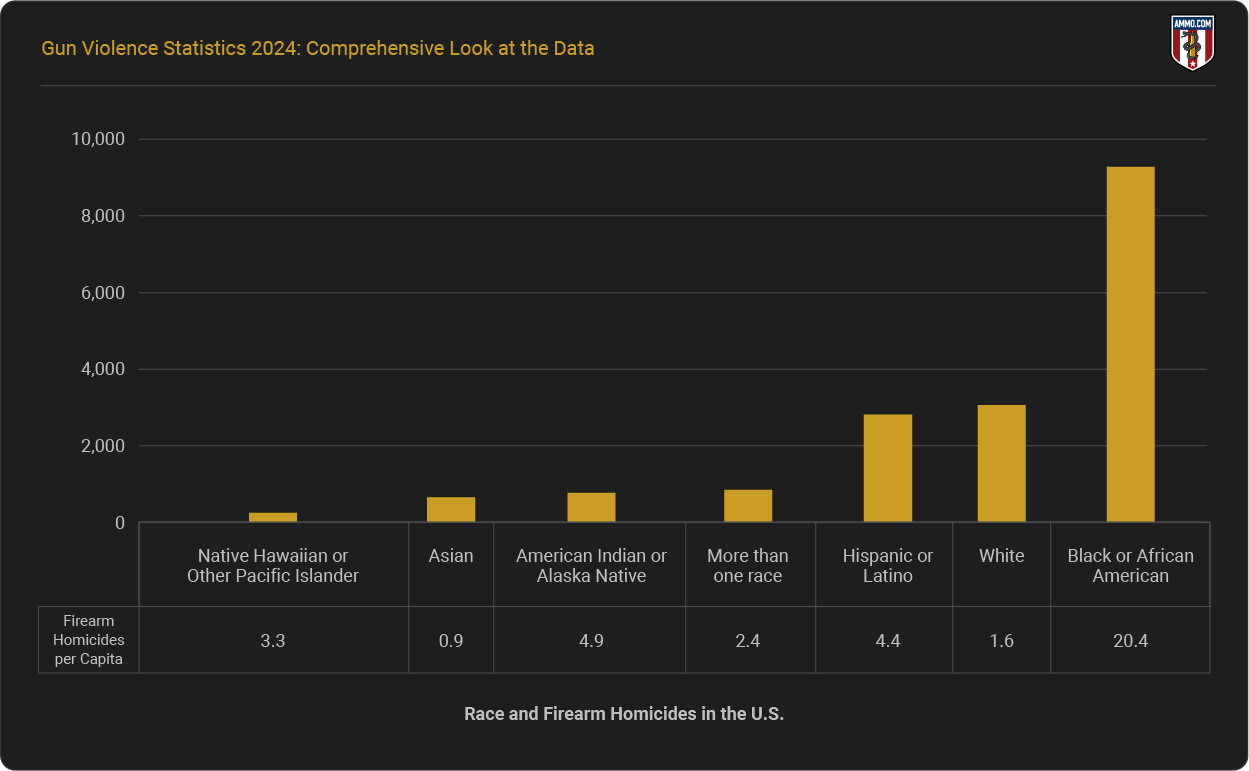
Your column labels are wrong, numbers and races don’t match the bars above them, which are sorted to increase left to right.
Sorted left to right across the bottom / increasing height it should be Asian,White, More than One Race, Native Hawaiian / Pacific Islander, Hispanic, American Indian/ Alaskan Native, Black.
Sorry Uncle Miltie, now I get it, the bars are totals, and to get the per capita you have to divide that bar by the population.
In my opinion a graph that showed the per capita propensity to murder would be more useful to make your point but thanks for putting the graph out there.
Years ago a racist told me “A Jew is just a nigger turned inside out.” Do you agree with him?