Posted on 07/16/2022 8:40:52 AM PDT by cuz1961
This report provides a current epidemiological update on the intensity and severity of COVID-19 in Manitoba. Surveillance and administrative data include laboratory, hospitalization and mortality data. Data are presented at the provincial and regional level. In this weekly report, we provide regular updates about the current activity of COVID-19 in Manitoba with a focus on severe outcomes (hospital admissions, intensive care unit admissions (ICU), and deaths).
(Excerpt) Read more at gov.mb.ca ...
Stunning official Canadian data show vaccines now RAISE the risk of death from Covid Alex Berenson Jul 15 674 576 Vaccinated people are now more likely to be hospitalized or die from Covid, even after adjusting for fact they're older than the unvaccinated, according to official government estimates from the Canadian province of Manitoba.
In May, the most recent month for which figures are available, only 9 percent of Covid deaths and 14 percent of hospital admissions in Manitoba occurred among unvaccinated people, even though they are 17 percent of the population.
Manitoba, which has about 1.4 million residents, also provides figures that are adjusted for the fact that vaccinated and boosted people tend to be older.
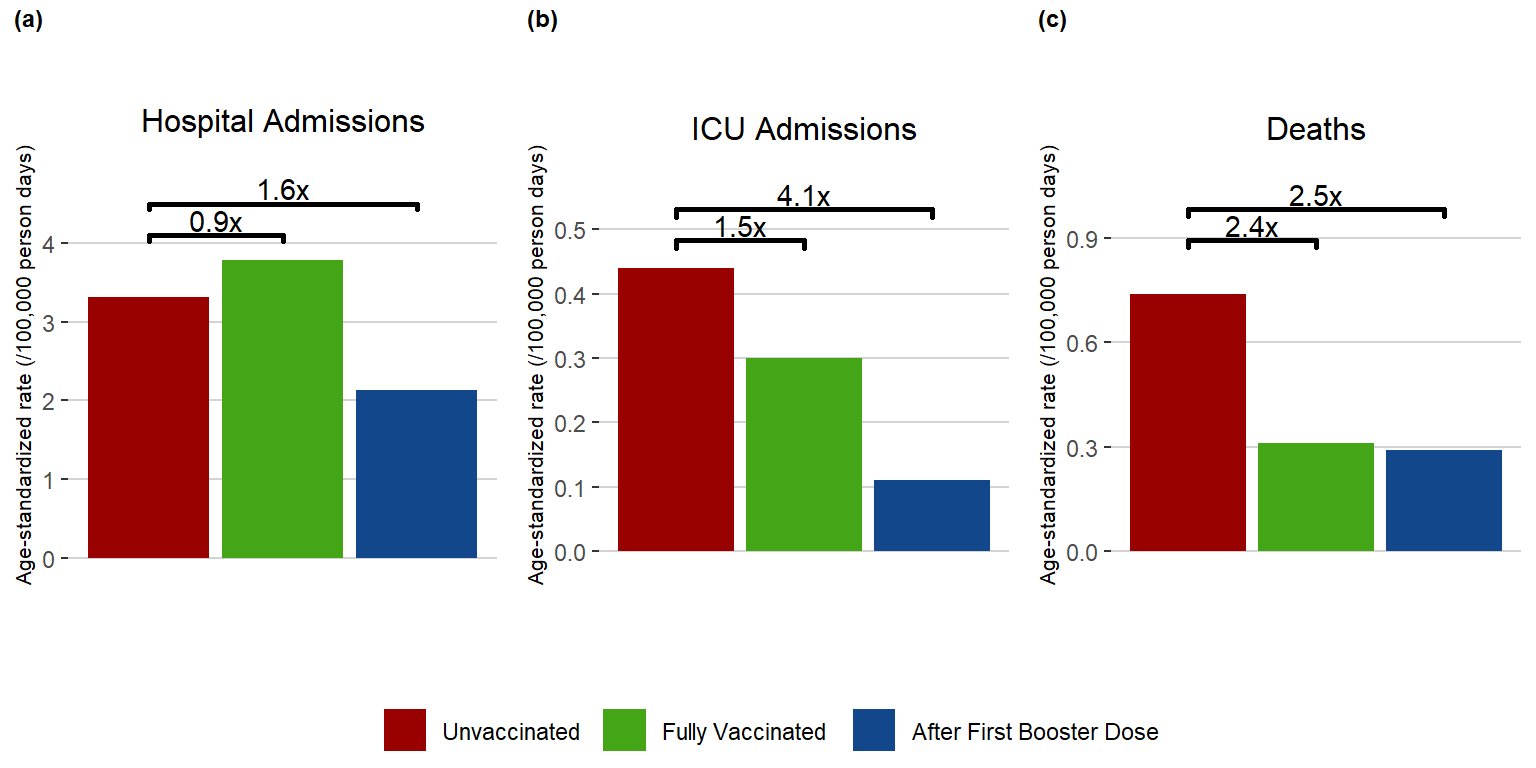
Those show that in May, vaccinated but unboosted people were about 50 percent more likely to be hospitalized or die of Covid than unvaccinated people. People who had received boosters had roughly the same risk of hospitalization or death as the unvaccinated.
Continues at..
https://alexberenson.substack.com/p/stunning-official-canadian-data-show/comments
.
These figures and estimates differ markedly from those the Centers for Disease Control have provided for American Covid deaths. But they are likely to be far more accurate. American hospitals and health authorities classify Covid deaths and hospitalizations as occurring in the unvaccinated until proven otherwise.
Countries with national health insurance can match their vaccination registries more easily against hospital admissions and deaths, and they have consistently shown much higher percentages of Covid deaths in vaccinated people.
Still, the data from Manitoba appear to mark the first time that any government agency has actually found a higher risk of death in vaccinated people.
To make it easier/more clear:
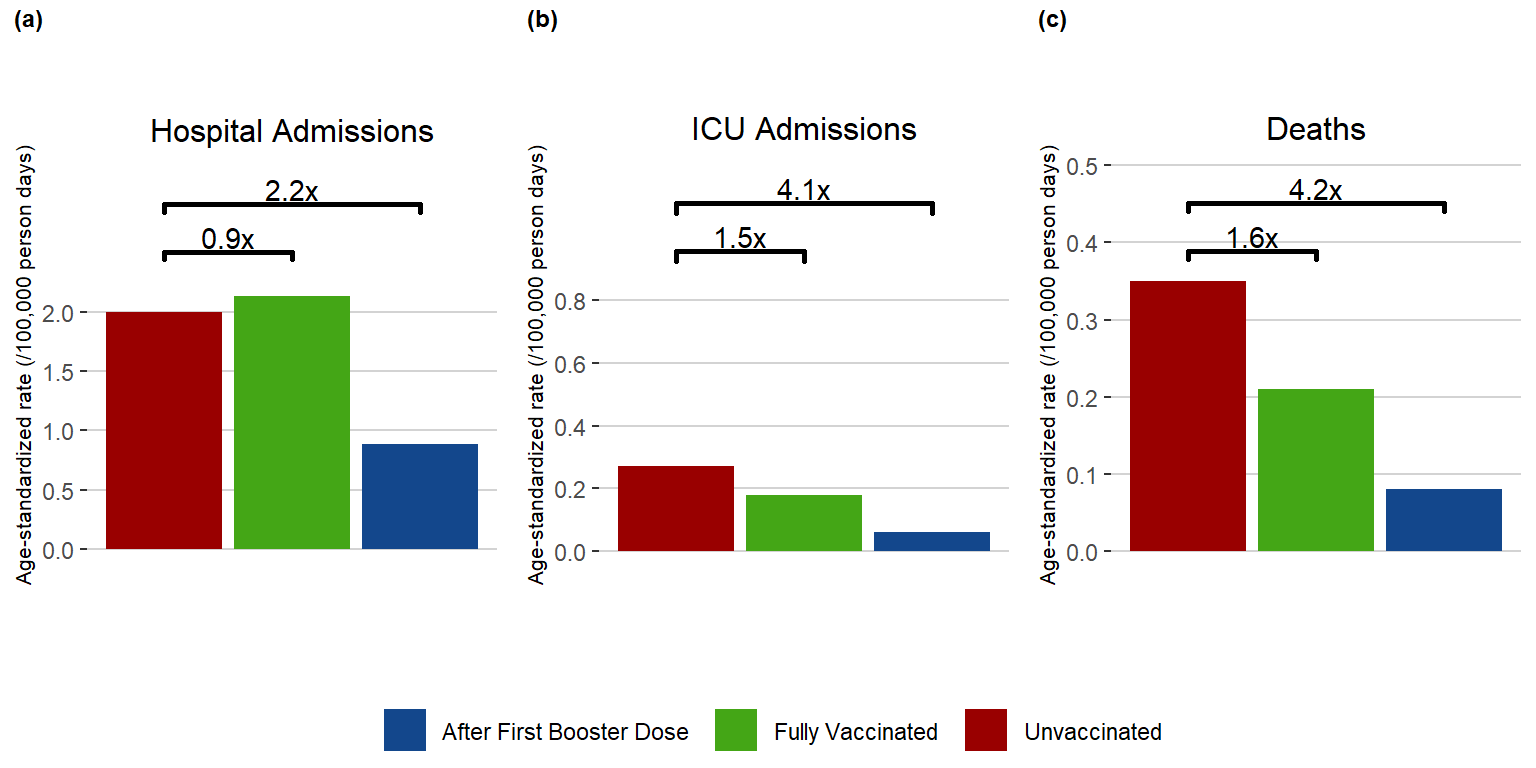
But if you look at the previous month, April 1, 2022 – April 30, 2022, ICU admissions are much higher in the unvaccinated and lowest in the boosted, and the death rate for the unvaccinated is way higher, lowest again in the boosted:
Web page:
https://www.gov.mb.ca/health/publichealth/surveillance/covid-19/2022/week_26/index.html
Similar in the month before that, March 1, 2022 – March 31, 2022, when hospital admissions were slightly higher for the fully vaccinated vs unvaccinated and much lower in the boosted; ICU admissions were higher for the unvaccinated and lowest in the bloosted,; death rate for unvaccinated highest by far, lowest for the boosted:
Web page:
https://www.gov.mb.ca/health/publichealth/surveillance/covid-19/2022/week_20/index.html
So why is May different from the previous months? Given how small are the numbers of hospitalizations, ICU admissions and deaths, it could easily be just a statistical hiccup. We can’t check it, as the numbers given for hospitilazation, ICU admission and death by age group are cumulative, beginning December 16, 2020. The page does not show the actual numbers by month to compare to the graph.
The total population of Manitoba is only 1,342,000. So, when you’re looking at a death rate risk of about 0.15 per 100,000 for the unvaccinated and boosted in May, that’s only 2 deaths in each group in all of Manitoba. And then there’s the death rate risk for the fully vaccinated of about 0.24 per 100,000, or 3.2 deaths. Add in the age standardization formula used on top of the low raw numbers, and, really how statistically relevant are any of these graphs? The confidence level must be pathetic.
Trust Berenson to choose this oddball graph as “proof” of his pet theory. smh
https://freerepublic.com/focus/news/4078678/posts?page=41#41
And:
If three obese unvaccinated people with diabetes died during a month, but only two fully vaccinated people with no risky underlying health conditions died, the graph would reverse. How would you like that? (BTW, there is no adjustment for those with/without comorbidities.) As those with such underlying health conditions are more likely to be vaccinated, such a scenario would be somewhat unlikely but entirely possible — we are talking very small numbers here where only one death death flips the chart.
As you can see, in previous months the charts showed the unvaccinated as having the highest risk for serious outcomes. The actual numbers involved are still very small, though, and I don’t think they can get anything statistically meaningful out them, either.
https://freerepublic.com/focus/news/4078678/posts?page=45#45
So why is May different from the previous months? Given how small are the numbers of hospitalizations, ICU admissions and deaths,......
......... it could easily be just a statistical hiccup....................... We can’t check it,
\/
That’s your ‘ debunk ‘ ?
Bwa ha ha ha.
5g weasel
just a statistical hiccup....................... We can’t check it,
/\
Limpest debunk yet.
I’m gonna have to lower your score to a 3g weasel.
No it is not limp. Read it again. Or do you have no experience doing statistical analysis?
just a statistical hiccup....................... We can’t check it
/\
I can read just fine.
Thousands of words to hide the sausage of
just a statistical hiccup....................... We can’t check it
.
You just got demoted to 2g weasel.
You obviously never even took the most basic college statistics class.
Heck, even high school math should suffice. When it’s a case of 3 vaccinated people and 2 unvaccinated died one month,, and in previous months it had been 4 unvaccinated, 2 vaccinated, etc., it’s quite obvious the numbers are too small to be significant in any way.
Oops. Double post by accident. At least I didn’t do it purpose like some people.
You obviously never even took the most basic college statistics class.
/\
No, but I know Hiccup is NOT a mathematical term.
/-)
’ can’t check “ is another set of words I don’t need a college.
statistic class.
“Can’t check “ kinda takes the
fact out of a fact check
No fact check no debunk
.
So , what else ya got left ?
Spoiler alert,
Insult or name calling will get your weasel score down to 1g weasel.
./-)
It’s possible to extrapolate how many people in each of the three groups died, were admitted to ICU, etc., from the information in the graphs.
If you want to take the time (which I did not), one could subtract out from the running cumulative totals how many in each age group died or were admitted to ICU, etc., each month and get the actual numbers broken down by age group. They’re simply not given by month on the page.
I gave the extrapolated numbers. If you think 3 vaccinated people vs 2 unvaccinated people dying one month is signifcant, do you also think 4 unvaccinated people vs 2 vaccinated people in a previous month is significant? You can’t have it both ways.
Name calling does not help your cause.
Re: “Insult or name calling will get your weasel score down to 1g weasel.”
Do you not see the irony here?
Re: “No, but I know Hiccup is NOT a mathematical term.”
Who said it was? But it is a real term:
https://letmegooglethat.com/?q=%22statistical+hiccup%22
Name calling does not help your cause.
/\
Weasel is a category of obfuscation, not a name.
The generation level is just degrees of that.
/-).
A 4g weasel term maybe.
First link was nbc.,,bwa ha ha ha.
Private Google huh ?
Wow !# new weasel gadgets!
Is that what weasels are using now days?
A Google link customised by and for bots and weasels ?
That deserves a bump back up to 5g weasel .
/-)
Here’s reality, When I enter
statistical hiccup
into Google myself,
(it does NOT take me to the page your bot link takes me to.)
It takes me to the real world definition of hiccup.
In the real world
A hiccup is an involuntary spasmodic contraction of the muscle at the base of the lungs (diaphragm) followed by the rapid closure of the vocal cords.
.
You aren’t helping yourself.
Cute customized weasel Google results link though.
5G weasel stuff there .
Your link
https://google.gprivate.com/search.php?search?q=hiccup
Vs.
My link
https://www.google.com/search?...
.
.
So,,,
You work at Google ?
That link of yours said a little more about you than you meant to say I think.
google.gprivate.com
What’s that ?
Your private Google work account addy ?
Do any other freepers out there have.
” private.com “
In their Google search links ?
Dude.
You outed yourself.
Do any other freepers out there have.
” gprivate.com “
In their Google search links ?
Disclaimer: Opinions posted on Free Republic are those of the individual posters and do not necessarily represent the opinion of Free Republic or its management. All materials posted herein are protected by copyright law and the exemption for fair use of copyrighted works.