To make it easier/more clear:
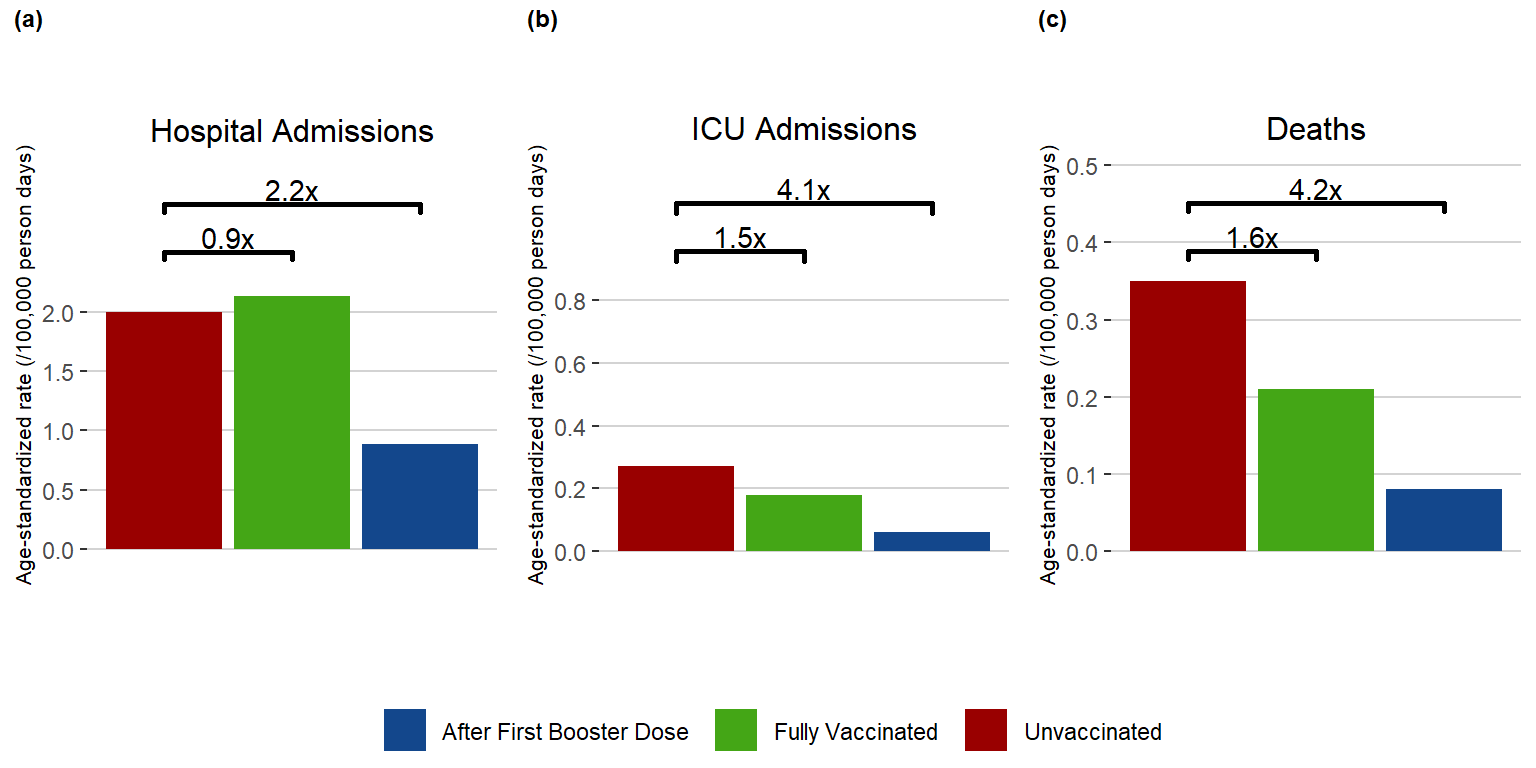
But if you look at the previous month, April 1, 2022 – April 30, 2022, ICU admissions are much higher in the unvaccinated and lowest in the boosted, and the death rate for the unvaccinated is way higher, lowest again in the boosted:
Web page:
https://www.gov.mb.ca/health/publichealth/surveillance/covid-19/2022/week_26/index.html
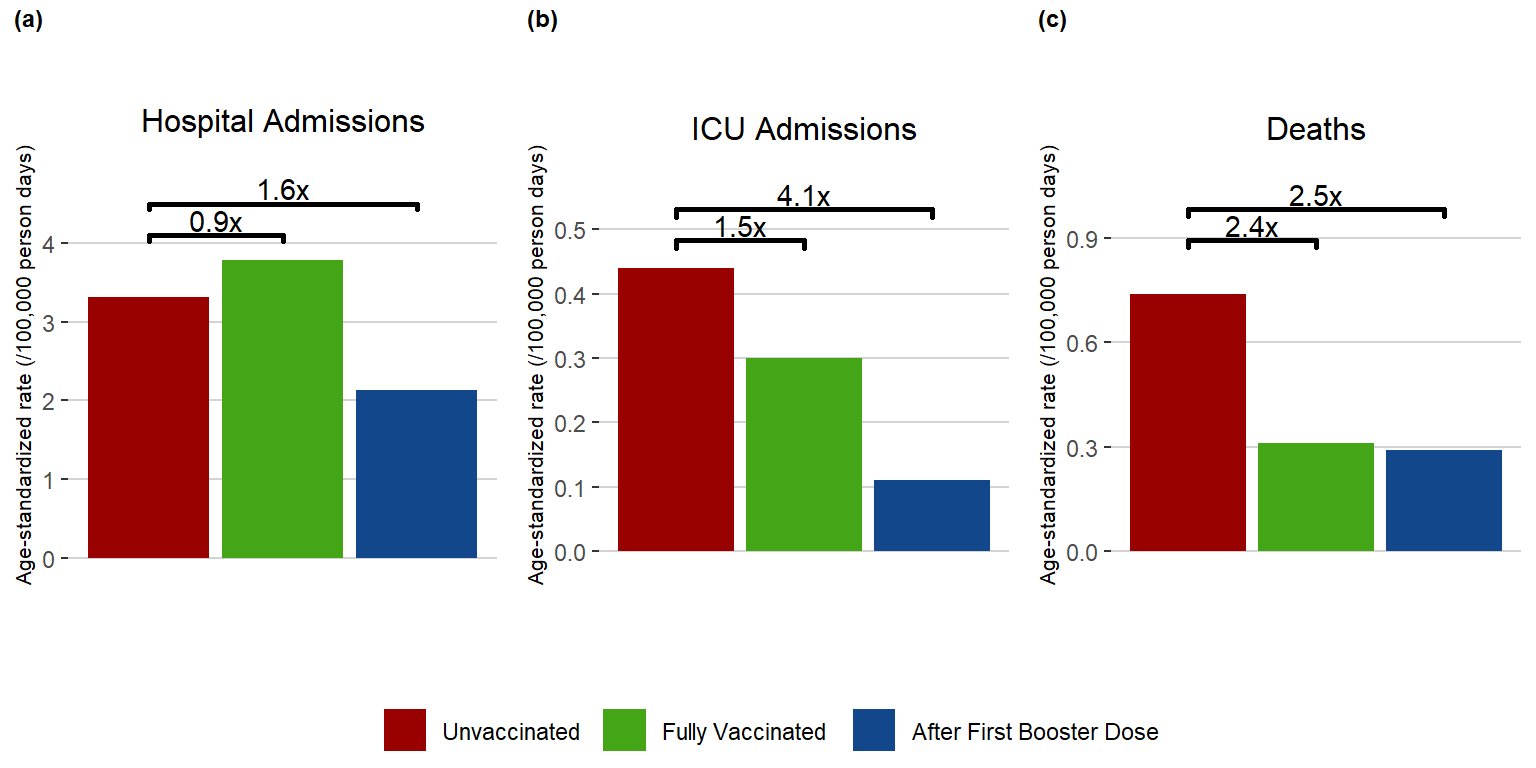
Similar in the month before that, March 1, 2022 – March 31, 2022, when hospital admissions were slightly higher for the fully vaccinated vs unvaccinated and much lower in the boosted; ICU admissions were higher for the unvaccinated and lowest in the bloosted,; death rate for unvaccinated highest by far, lowest for the boosted:
Web page:
https://www.gov.mb.ca/health/publichealth/surveillance/covid-19/2022/week_20/index.html
So why is May different from the previous months? Given how small are the numbers of hospitalizations, ICU admissions and deaths, it could easily be just a statistical hiccup. We can’t check it, as the numbers given for hospitilazation, ICU admission and death by age group are cumulative, beginning December 16, 2020. The page does not show the actual numbers by month to compare to the graph.
The total population of Manitoba is only 1,342,000. So, when you’re looking at a death rate risk of about 0.15 per 100,000 for the unvaccinated and boosted in May, that’s only 2 deaths in each group in all of Manitoba. And then there’s the death rate risk for the fully vaccinated of about 0.24 per 100,000, or 3.2 deaths. Add in the age standardization formula used on top of the low raw numbers, and, really how statistically relevant are any of these graphs? The confidence level must be pathetic.
Trust Berenson to choose this oddball graph as “proof” of his pet theory. smh
https://freerepublic.com/focus/news/4078678/posts?page=41#41
And:
If three obese unvaccinated people with diabetes died during a month, but only two fully vaccinated people with no risky underlying health conditions died, the graph would reverse. How would you like that? (BTW, there is no adjustment for those with/without comorbidities.) As those with such underlying health conditions are more likely to be vaccinated, such a scenario would be somewhat unlikely but entirely possible — we are talking very small numbers here where only one death death flips the chart.
As you can see, in previous months the charts showed the unvaccinated as having the highest risk for serious outcomes. The actual numbers involved are still very small, though, and I don’t think they can get anything statistically meaningful out them, either.
https://freerepublic.com/focus/news/4078678/posts?page=45#45
just a statistical hiccup....................... We can’t check it,
/\
Limpest debunk yet.
I’m gonna have to lower your score to a 3g weasel.