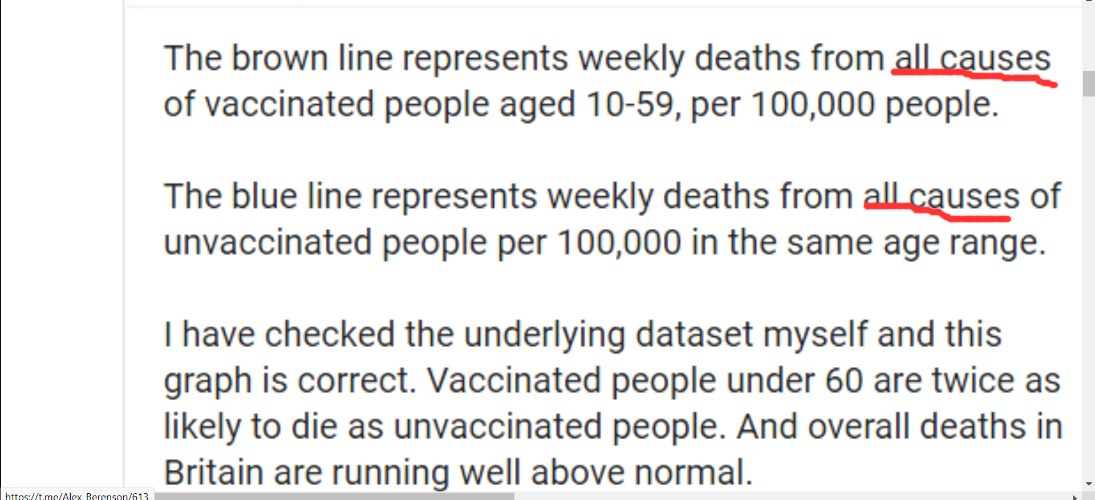
Did anybody mention corona virus, genius? Does the term 'all causes' mean anything to you?
 #StayOutOfTheDeepEnd
No idea who Alex Berenson is, but the data source he links to shows his chart is false.
From the data source he uses:
“Between 2 January and 24 September 2021, the age-adjusted risk of deaths involving coronavirus (COVID-19) was 32 times greater in unvaccinated people than in fully vaccinated individuals.”
And this table (the formatting didn’t carry over in my post, but you can read the label at the link):
Table 1: The age-standardised mortality rate for deaths involving COVID-19 is 32 times higher for unvaccinated people than for those who received the second dose
Age-standardised mortality rates for all deaths and deaths involving COVID-19, England, deaths occurring between 2 January and 24 September 2021
Age-standardised mortality rate per 100,000 person-years
(95% confidence interval)
Vaccination status Deaths involving COVID-19 All deaths
Unvaccinated 849.7 (840.3, 859.2) 2,187.1 (2,172.2, 2,202.0)
Received only the first dose,
less than 21 days ago 192.4 (182.4, 202.4) 811.9 (793.4, 830.4)
Received only the first dose,
at least 21 days ago 105.3 (102.8, 107.8) 1,124.3 (1,115.9, 1,132.7)
Received the second dose,
less than 21 days ago 7.2 (6.1, 8.2) 464.6 (455.8, 473.4)
Received the second dose,
at least 21 days ago 26.2 (25.4, 27.1) 783.6 (779.1, 788.0)
Source: Office for National Statistics – Public Health Data Asset, National Immunisation Management Service
That's right. I have the XLS spreadsheet right in front of me.
He also says he doesn't know how to explain his (wrong) conclusion. That's probably because he didn't bother to read the footnotes that came with the data set.
"9. For the 10-59 age group, the vaccinated population will on average be older than the unvaccinated population due to age-based prioritisation in the vaccine roll-out. As mortality rates are higher for older people, this will increase the mortality rates for the vaccinated population compared to the unvaccinated population."
Pretty much standard-issue anti-vax misinformation.
Your data is only for deaths related to Covid-19; Berenson’s data is for deaths from ALL causes in the 10-59 age group.
Hard to know what to believe, tomorrow there Wil, be a report showing the opposite likely back and forth it goes, kinda like the data on eating eggs and real butter. One year it’s o,, the next you gotta avoid, the next it’s OK again
Did anybody mention corona virus, genius? Does the term 'all causes' mean anything to you?
#StayOutOfTheDeepEnd
No idea who Alex Berenson is, but the data source he links to shows his chart is false.
~~~~~~~~~~~~~
Your data, and attempt to refute Alex’s, is false. I don’t know you so I guess time will tell if that’s intentional.
He quoted all cause mortality and you refuted with
‘with Covid’ mortality.
Deaths resulting from the ‘vaccine’ are attributed to natural causes - that’s why all cause mortality is up.