To: SeekAndFind
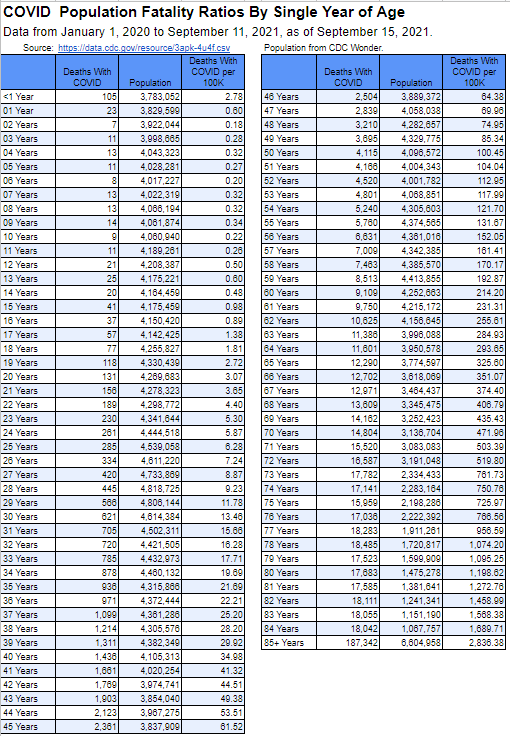
Phil Kerpen, the president of American Commitment and Unleash Prosperity, has taken the CDC’s data and broken down the risk of dying from COVID by single year of age.
So, let’s look at the chart and see what my risk is. I am 41 years old. Based on this chart, there have been 1,661 deaths from COVID among 41-year-olds—representing .041 percent of that population segment.
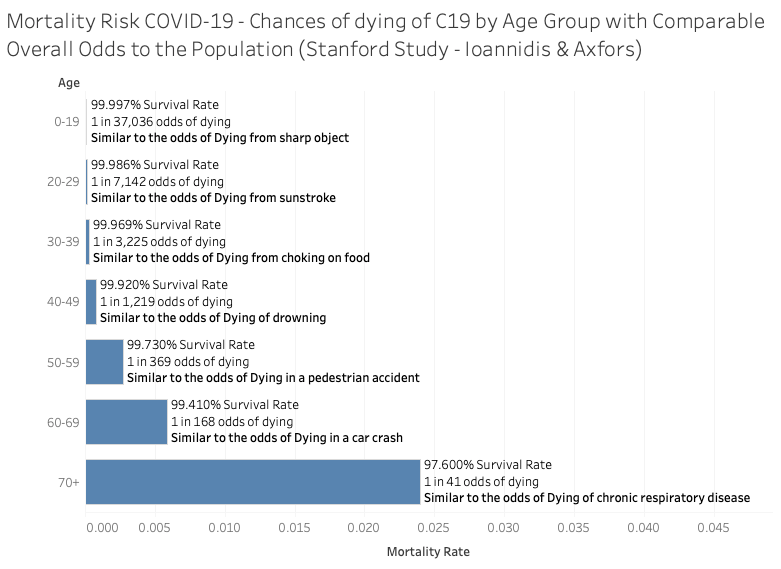
Of course, you might look up your age on the chart and wonder what these numbers mean in practical terms. Well, there’s a chart for that too.
According to this chart, my risk of dying from COVID is comparable to my risk of dying by drowning. Well, isn’t that interesting? Should I be afraid of the water? Should I never go swimming again? Of course not. But when you look at this chart and you look at your comparable mortality risk, it puts this pandemic in perspective, doesn’t it?
To: SeekAndFind
5 posted on
09/22/2021 8:48:41 PM PDT by
Cedar
To: SeekAndFind; All
Anyone who believes these numbers is a fool. Doctors and hospitals have admitted to gaming the numbers with suicides, gunshot fatalities, drownings, car crashes, etc.
6 posted on
09/22/2021 8:48:48 PM PDT by
Cobra64
(Common sense isn’t common anymore.)
To: SeekAndFind
Deaths with covid
What about deaths from covid?
8 posted on
09/22/2021 9:01:20 PM PDT by
LibertyWoman
(Woe to those who call evil good, and good evil... Isaiah 5:20)
To: SeekAndFind
This is a great graphic (the one comparing the odds of fatality to other events)
Thanks for posting it, SeekAndFind. You generally do a pretty good job of selecting your subjects to start threads on, and this is no exception.
9 posted on
09/22/2021 9:02:44 PM PDT by
rlmorel
(Leftists are The Droplet of Sewage in a gallon of ultra-pure clean water.)
To: SeekAndFind; Red Badger; Liz
Good chart, thank you.
Saw one the other day - but (naturally) cannot find it now. Was a US graphic highlighting the states by morbidity, with New York, New Jersey, Mass, Mi, ILL, CA in darker shades of green. Do you, or anybody else, recall seeing it?
11 posted on
09/22/2021 9:08:19 PM PDT by
Robert A Cook PE
(Method, motive, and opportunity: No morals, shear madness and hatred by those who cheat.)
To: SeekAndFind
17 posted on
09/22/2021 9:19:10 PM PDT by
FreedomPoster
(Islam delenda est)
>> 99.997% survival for those less than 20 YO
Those going after the youth are predators!
Nobody likes child predators.
18 posted on
09/22/2021 9:19:37 PM PDT by
Gene Eric
(Don't be a statist!)
To: SeekAndFind
It's actually less than that as most who were infected had mild to moderate symptoms, were never tested and, hence, weren't included in the calculations.
Then, of course, we have the unreliable PRC tests, with a high rate of false positives, so I guess it's a wash.
19 posted on
09/22/2021 9:21:42 PM PDT by
Eagles6
(Welcome to the Matrix . Orwell's "1984" was a warning, not an instruction manual.)
To: SeekAndFind
Seeing those figures, I am more confident that my infection from COVID-19-Delta will not be a trip to the morgue. However, a trip to the hospital may be bad enough. Does anyone know what a one month stay in the hospital, fighting for ones life on a ventilator will cost?
People poo poo the low death rate but exhibit a kind of naivety about the outcome. For instance, I just became aware of Covid victims so desperate to stay alive, they are having lung transplants! Imagine what that will cost! Of course, there are other long-term side-effects that also seem to slip down the rat-hole of conversation.
29 posted on
09/23/2021 2:36:58 AM PDT by
jonrick46
(Leftnicks chase illusions of motherships at the end of the pier.)
To: SeekAndFind
According to this chart, my risk of dying from COVID is comparable to my risk of dying by drowning.
Those comparisons seem peculiar, and would need digging into to understand.
The chances of drowning while swimming might have a lifetime chance of 1/1219 for which reason you died if you engaged in swimming at an average rate, but it doesn’t reflect your chance of drowning while going to the grocery store.
32 posted on
09/23/2021 6:50:24 AM PDT by
lepton
("It is useless to attempt to reason a man out of a thing he was never reasoned into"--Jonathan Swift)
To: SeekAndFind
According to this chart, my risk of dying from COVID is comparable to my risk of dying by drowning.
Those comparisons seem peculiar, and would need digging into to understand.
The chances of drowning while swimming might have a lifetime chance of 1/1219 for which reason you died if you engaged in swimming at an average rate, but it doesn’t reflect your chance of drowning while going to the grocery store.
33 posted on
09/23/2021 6:50:51 AM PDT by
lepton
("It is useless to attempt to reason a man out of a thing he was never reasoned into"--Jonathan Swift)
To: SeekAndFind
So, let’s look at the chart and see what my risk is. I am 41 years old. Based on this chart, there have been 1,661 deaths from COVID among 41-year-olds—representing .041 percent of that population segment. Do note that column two is not labeled “Deaths FROM COVID” but rather “Deaths WITH COVID”.
That’s a BIG difference there.
Subtle but significant.
34 posted on
09/23/2021 6:56:53 AM PDT by
metmom
(...fixing our eyes on Jesus, the Author and Perfecter of our faith…)
To: SeekAndFind
Thanks for the charts. These charts put every thing in perspective.
:)
To: SeekAndFind
Your chart itself admits to lying.
Headsings are "Deaths *with* COVID" not Deaths *from* COVID
38 posted on
09/23/2021 7:41:33 AM PDT by
ShadowAce
(Linux - The Ultimate Windows Service Pack )
To: SeekAndFind
There is no way to determine this since all covid numbers have been fraudulent from the beginning.
42 posted on
09/23/2021 7:53:03 AM PDT by
CodeToad
(Arm up! They Have!)
FreeRepublic.com is powered by software copyright 2000-2008 John Robinson