Free Republic
Browse · Search
General/Chat
Topics · Post Article

To: DrewsMum
You need a serious eye exam and soon LOL ! May be you can still see enough to see hospitalization rates plummeting. And what has math to do with reading data charts? I assume you are not STEM educated.

https://gis.cdc.gov/grasp/COVIDNet/COVID19_3.html


37 posted on 05/07/2021 7:24:51 PM PDT by entropy12
[ Post Reply | Private Reply | To 33 | View Replies ]


To: entropy12

38 posted on 05/07/2021 7:32:23 PM PDT by entropy12
[ Post Reply | Private Reply | To 37 | View Replies ]

To: entropy12

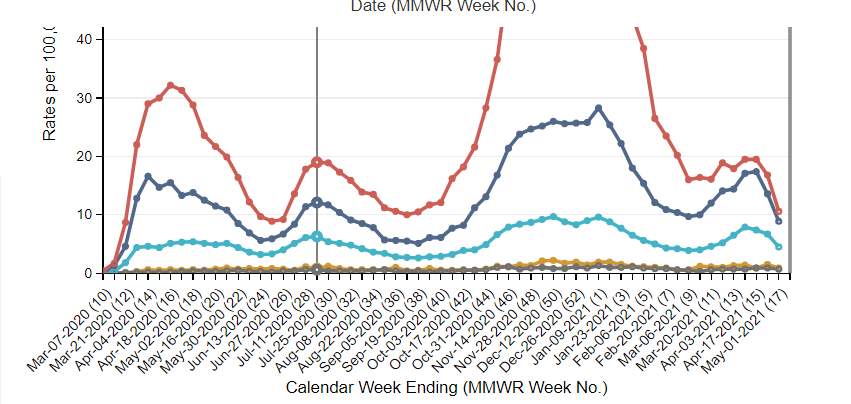
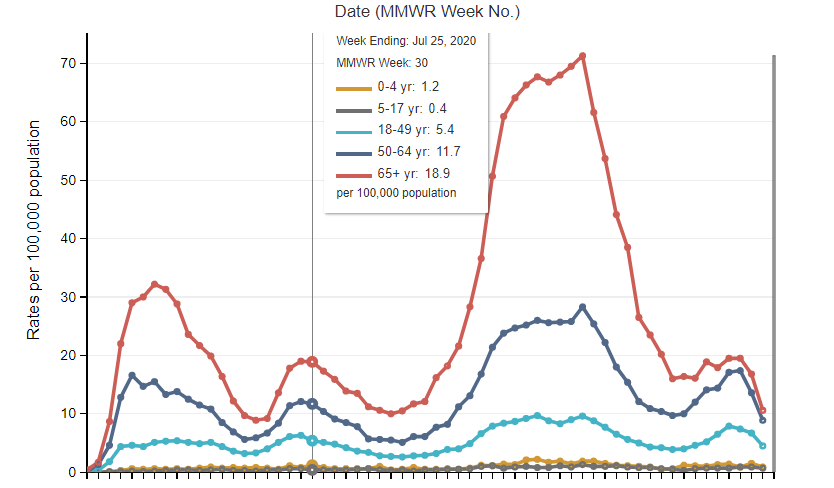
What is the source? That says nothing about hospitalization rates.


53 posted on 05/10/2021 8:01:14 PM PDT by DrewsMum
[ Post Reply | Private Reply | To 37 | View Replies ]

To: entropy12

Wait. I see the source. You aren’t wrong about my eyes. Lol.


54 posted on 05/10/2021 8:02:19 PM PDT by DrewsMum
[ Post Reply | Private Reply | To 37 | View Replies ]

To: entropy12

Ok I looked at the source.

They are calculating hospitalization rates by population?

It should be by x/y with x=hosp and y = infections.

Hospitalization rates to check the severity of the disease should go by infections. Not population. That doesn’t give a clear picture.

More people who are getting covid are being hospitalized this year. It’s double the rate.

Do the math.


55 posted on 05/10/2021 8:08:16 PM PDT by DrewsMum
[ Post Reply | Private Reply | To 37 | View Replies ]

Free Republic
Browse · Search
General/Chat
Topics · Post Article


FreeRepublic, LLC, PO BOX 9771, FRESNO, CA 93794
FreeRepublic.com is powered by software copyright 2000-2008 John Robinson