From Instapundit tonight --
Here's the cite about statistical evidence being allowed in court cases. Let's see if it gets let thru
11 F.3d 1467 (9th Cir. 1993)
= = = = = = =< that's a 9th Circuit case.
Here is a link to a bunch of other cases where statistical evidence has been allowed
forensus[dot]com/statistical-sampling-case-law/
Replace [dot] with . and you should be good to go
= = = = = = = = This thread shows Banford’s Law in all its glory - even showing Enron as an example.
(sorry, I lost that link, it was thereaderapp...)
?
= = = = = = = = =
Now a FR link on Benford's Law:
http://www.freerepublic.com/focus/f-news/3903139/posts
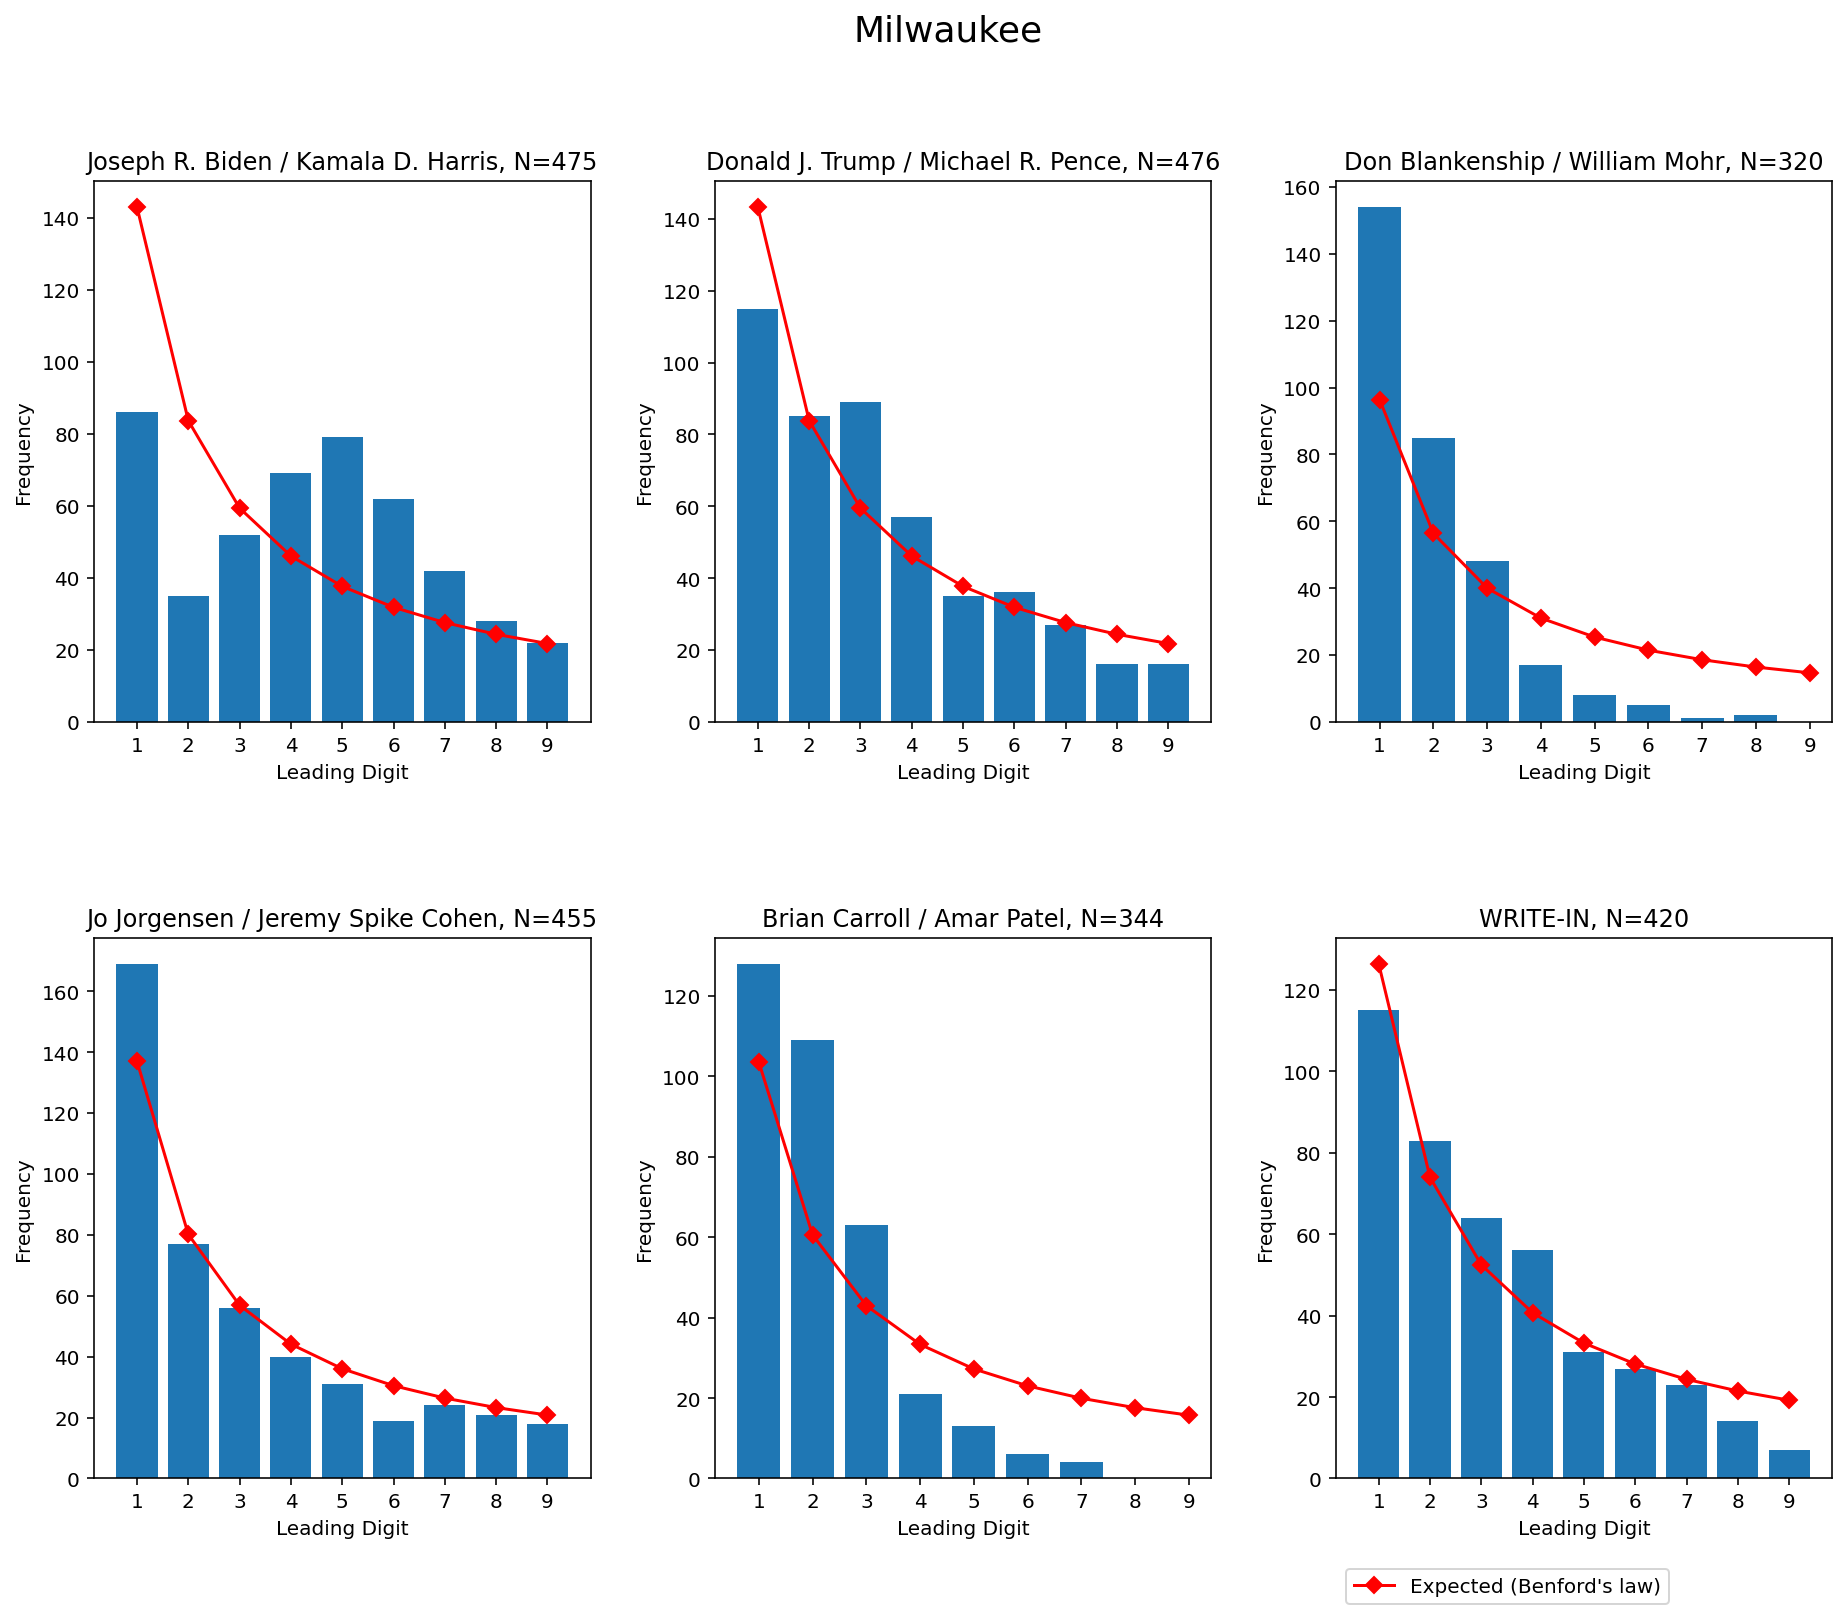
And a pic within that thread comparing races in Wisconsin:
And my explanation within that thread:
Can you tell us in english what these graphs mean?
Yep. Each graph is a bar chart, the digits 1...2...3...4...5...6...7...8...9. That's the x-axis, along the bottom.
The bar chart, shows how many TIMES, that digit, was the first number in a count of votes.
Those are the blue rectangles. To find the count, trace from the top of the blue rectangle over to the Y-axis, the vertical line.
So in the lower left, that's the inddpendent candidate, Jo Jorgensen.
So the digit 1 shows up 163 times (that's how high the blue rectangle is).
The digit 2 shows up 78 times.
And so on.
The red line on the graph is the prediction of Benford's Law.
The shape is right -- you have a LOT for 1, and it curves smoothly down.
Now look at Biden's graph -- it's all screwy, it's got a big hill in the middle. People trying to fake counts, often choose 4, 5, and 6 a lot, because "they're near the middle" and so, instead of being clever and covering up the fake like they think, they stick out like a sore thumb.
Trump's got a bit of deviation too; but that might be from votes being thrown OUT by crooked counters or machine *ahem* "glitches".