
Posted on 12/21/2014 9:42:09 PM PST by Ernest_at_the_Beach
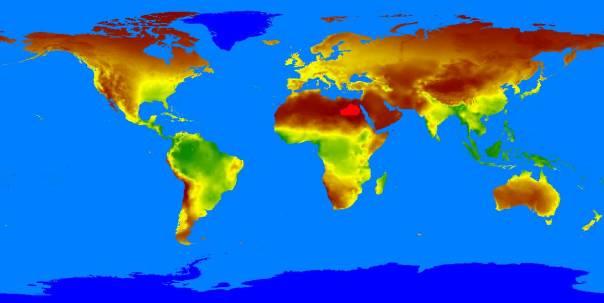
Global atmospheric carbon dioxide concentrations from Oct. 1 through Nov. 11, as recorded by NASA’s Orbiting Carbon Observatory-2. Carbon dioxide concentrations are highest above northern Australia, southern Africa and eastern Brazil. Preliminary analysis of the African data shows the high levels there are largely driven by the burning of savannas and forests. Elevated carbon dioxide can also be seen above industrialized Northern Hemisphere regions in China, Europe and South America and Africa. Image credit: NASA/JPL-Caltech
The first global maps of atmospheric carbon dioxide from NASA’s new Orbiting Carbon Observatory-2 mission demonstrate its performance and promise, showing elevated carbon dioxide concentrations across the Southern Hemisphere from springtime biomass burning.
At a media briefing today at the American Geophysical Union meeting in San Francisco, scientists from NASA’s Jet Propulsion Laboratory, Pasadena, California; Colorado State University (CSU), Fort Collins; and the California Institute of Technology, Pasadena, presented the maps of carbon dioxide and a related phenomenon known as solar-induced chlorophyll fluorescence and discussed their potential implications.
A global map covering Oct. 1 through Nov. 17 shows elevated carbon dioxide concentrations in the atmosphere above northern Australia, southern Africa and eastern Brazil.
“Preliminary analysis shows these signals are largely driven by the seasonal burning of savannas and forests,” said OCO-2 Deputy Project Scientist Annmarie Eldering, of JPL. The team is comparing these measurements with data from other satellites to clarify how much of the observed concentration is likely due to biomass burning.
The time period covered by the new maps is spring in the Southern Hemisphere, when agricultural fires and land clearing are widespread. The impact of these activities on global carbon dioxide has not been well quantified. As OCO-2 acquires more data, Eldering said, its Southern Hemisphere measurements could lead to an improved understanding of the relative importance in these regions of photosynthesis in tropical plants, which removes carbon dioxide from the atmosphere, and biomass burning, which releases carbon dioxide to the atmosphere.
The early OCO-2 data hint at some potential surprises to come. “The agreement between OCO-2 and models based on existing carbon dioxide data is remarkably good, but there are some interesting differences,” said Christopher O’Dell, an assistant professor at CSU and member of OCO-2’s science team. “Some of the differences may be due to systematic errors in our measurements, and we are currently in the process of nailing these down. But some of the differences are likely due to gaps in our current knowledge of carbon sources in certain regions — gaps that OCO-2 will help fill in.”
Carbon dioxide in the atmosphere has no distinguishing features to show what its source was. Elevated carbon dioxide over a region could have a natural cause — for example, a drought that reduces plant growth — or a human cause. At today’s briefing, JPL scientist Christian Frankenberg introduced a map using a new type of data analysis from OCO-2 that can help scientists distinguish the gas’s natural sources.
Through photosynthesis, plants remove carbon dioxide from the air and use sunlight to synthesize the carbon into food. Plants end up re-emitting about one percent of the sunlight at longer wavelengths. Using one of OCO-2’s three spectrometer instruments, scientists can measure the re-emitted light, known as solar-induced chlorophyll fluorescence (SIF). This measurement complements OCO-2’s carbon dioxide data with information on when and where plants are drawing carbon from the atmosphere.
“Where OCO-2 really excels is the sheer amount of data being collected within a day, about one million measurements across a narrow swath,” Frankenberg said. “For fluorescence, this enables us, for the first time, to look at features on the five- to 10-kilometer scale on a daily basis.” SIF can be measured even through moderately thick clouds, so it will be especially useful in understanding regions like the Amazon where cloud cover thwarts most spaceborne observations.
The changes in atmospheric carbon dioxide that OCO-2 seeks to measure are so small that the mission must take unusual precautions to ensure the instrument is free of errors. For that reason, the spacecraft was designed so that it can make an extra maneuver. In addition to gathering a straight line of data like a lawnmower swath, the instrument can point at a single target on the ground for a total of seven minutes as it passes overhead. That requires the spacecraft to turn sideways and make a half cartwheel to keep the target in its sights.
The targets OCO-2 uses are stations in the Total Carbon Column Observing Network (TCCON), a collaborative effort of multiple international institutions. TCCON has been collecting carbon dioxide data for about five years, and its measurements are fully calibrated and extremely accurate. At the same time that OCO-2 targets a TCCON site, a ground-based instrument at the site makes the same measurement. The extent to which the two measurements agree indicates how well calibrated the OCO-2 sensors are.
Additional maps released today showed the results of these targeting maneuvers over two TCCON sites in California and one in Australia. “Early results are very promising,” said Paul Wennberg, a professor at Caltech and head of the TCCON network. “Over the next few months, the team will refine the OCO-2 data, and we anticipate that these comparisons will continue to improve.”
To learn more about OCO-2, visit:
Caltech manages JPL for NASA.
I may just misunderstand the map, but I can't see this...
Sure that screenshot doesn’t just correspond with higher temperatures because the heaviest co concentrations seem to be near the equator...
It would seem that despite the GW alarmist claims, it is not the US that is putting high levels of CO2 in the atmosphere.
fyi
“Carbon dioxide in the atmosphere has no distinguishing features to show what its source was.”
OMG!! What an agenda killer statement! They always swear to God/gods/Gaia/satan that it’s all manmade and they need trillions of dollars from puking disgusting epic fail mankind to “fix” it!
Morons. Humans are definitely in epic fail mode, but it’s not because of naturally occurring gases on the planet.
With the exception of China, all of those areas seem to be either jungle, or Volcanic.
Imagine THAT ONE, eh??
This does not fit the pre-approved liberal echowhacko narrative!
You can’t see it? It is right there over Indonesia.
At least it is now clear as day that we Americans are NOT the cause for “global warming”
Which is not ‘over northern Australia’. It’s over Indonesia.
I don’t understand.
Must be from wood burning stoves there,
Lookit all that CO2 over the Amazon Rainforest...welp, those darn trees are just gonna have to go! Tree-made Grobull Warming!
Especially to this one:
which is said to show Net Primary Production from 1951-2001.
As I understand it, NPP shows where most carbon dioxide is turned by photoynthesis into chemical energy.
To my completely layman eyes, it looks like the areas that the map you've shared here, matches this NPP map pretty well.
And that to me would seem to suggest a mechanism by which CO2 concentrates in the areas of the world where it does the most good.
I'm not an expert of any sort on this. I just notice this and wonder what is going on. I may be completely misunderstanding both maps.
rainforests cause global warming
**************************************************EXCERPT*************************************
Not (yet) for today’s satellite, but if the data are getting more and more accurate and the satellite has features to concentrate on “hot spots” like populated areas or forests, the possibilities of exact source/sink determination are increasing.
About determination of the global source, here two graphs that show the influence of vegetation and humans:

This shows the opposite δ13C and CO2 rate of changes, slightly after the temperature variations: CO2/δ13C follow temperature changes as can be seen for the 1998 El Niño in opposite ways. That shows that the (tropical) forests are the main cause of both changes. If the extra CO2 increase was from the oceans, the CO2 and δ13C changes would be in the same direction, as the δ13C level from oceanic CO2 is higher than of the atmosphere.
Over longer term, humans are the cause of the δ13C decline, as the contribution from the biosphere and oceans is positive in δ13C:

***********************************EXCERPT**************************************
Tom J says:
The revenue generating mystery novel needs a mysterious, and changing villain if the public is to be constantly coaxed into dispensing hard earned money.
Tom, the satellite doesn’t measure isotopes, it only measures total CO2. But if you look at the isotopes (taken at many places on earth), there is a firm decline in “heavy” 13CO2. That has two main possible sources: new biological carbon and fossil biological carbon (and maybe some a-biological too). But the biosphere as a whole is a net sink for CO2 (~1 GtC/year), thus not the cause of the 13C decline…
The decline of 13C exactly follows human emissions, be it at about 1/3rd of the theoretical decline, if it all remained in the atmosphere. As there is a lot of exchange with other reservoirs, mainly the deep oceans, a large part of the low-13CO2 from burning fossil fuels is replaced by high-13CO2 from the oceans.
Drought (in the tropics) also shows up both in the CO2 rate of change as in the 13C rate of change: while the rate of change increases during an El Niño, the 13C rate of change drops and vv., but that are temporarily wiggles which last maximum 2-3 years. Anyway, those wiggles are clearly caused by vegetation (decay goes on while growth is suppressed), but on longer term, vegetation is a net sink for CO2 and preferably 12CO2, leaving relative more 13CO2 in the atmosphere…
“Carbon dioxide in the atmosphere has no distinguishing features to show what its source was.”
So then the quote from the post is not factual? We can measure atmospheric CO2 and precisely determine its source?
Make the ...Used to be jungle....
The high CO2 in southern hemisphere and around Indonesia is because of burning off jungle to plant palm oil trees.....so the greenies can use non crude oil derivtives inb their cars.

Above shows deforestation regions.

Above shows typical palm oil plantation on former jungle.
Now that is super interesting!
Disclaimer: Opinions posted on Free Republic are those of the individual posters and do not necessarily represent the opinion of Free Republic or its management. All materials posted herein are protected by copyright law and the exemption for fair use of copyrighted works.