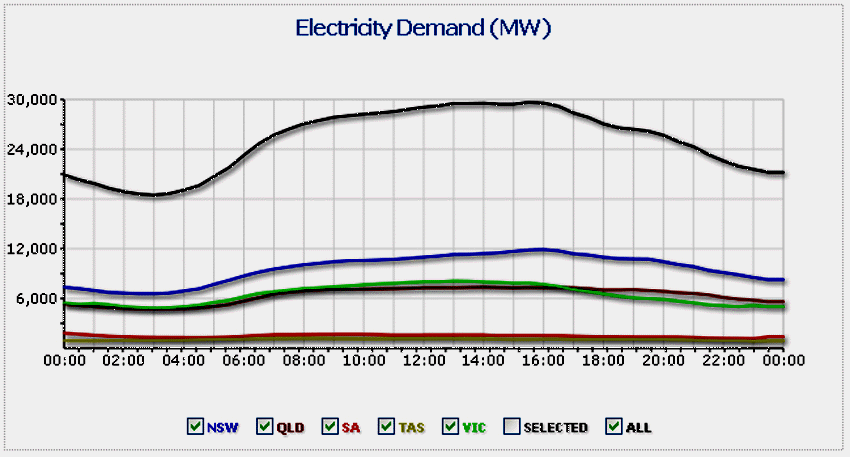
Summer power curve - Time of Day versus power consumption (MW)
Posted on 05/21/2012 2:51:27 PM PDT by Ernest_at_the_Beach
I’m away, so this is a good time for Guest posts. Here Tony explains that we need lots of electricity even while we sleep. I didn’t realize our electricity needs were so high at night. The lowest power use each day is still as much as 60% of the peak. That’s the base load at 3am, and solar panels and wind farms just can’t provide it. We can burn the odd $500 billion building hundreds of solar plants, but even then, we would have to go “medieval” for about 8 hours each night. Candles anyone? — Jo
AUSTRALIAN POWER CONSUMPTION LOAD CURVES
There’s a message in these two diagrams that underlies every decision about national energy.
Summer power curve - Time of Day versus power consumption (MW)
These two diagrams are the most misunderstood images in the whole debate — the Load Curves for actual power consumption. These two shown here are for the whole of eastern Australia (including Tasmania and South Australia).
The top diagram shows typical consumption for a day in mid summer (Monday 30th January 2012) and the second is for a typical mid winter day (Friday 22nd July 2011). (Usually peak winter consumption is a bit higher).
Consumption dips at 3AM to 4 AM on both diagrams to 18,000MW. So even when asleep, eastern Australia is consumes 18,000MW of power, basically 60% to 65% of every Watt of power that could be generated (generation capacity is about equal to the peak load).

Winter power curve: Time of Day versus power consumption (MW)
That level of power is required absolutely for the full 24 hours of every day, i.e. 24/7/365. It’s the Base Load — two words here, not just one word used as an adjective to describe coal fired power plants. It’s the minimum actual physical power just to keep things running in eastern Australia.
That power is supplied by plants running flat out at 3,000 RPM day in and day out. The only time they stop is when one generator at each plant is turned off for maintenance purposes. At these times, other large scale coal fired plants supply what is now out of service. These plants are mainly those on spinning reserve, and it’s described that way because those large scale generators take anything up to days to run down correctly, and then run back up correctly. So, typically older plants are kept on spinning reserve, in other words, running at speed but not supplying power, so, when needed they are ready to come on line delivering power.
The key here is that we just can’t store electrical energy on a big scale.
The extra power required above that Base Load is called Peaking Power (or Peak Power). Peaking Power is an everyday occurrence — other power plants are brought on line to ‘top up’ the power. Again, this power has to be on stand-by ready for consumption. If power is predicted to be consumed, then the grid controllers need that power already at the grid, ready for it to be drawn down by people in homes with plasma TV’s and ovens and toasters. Peaking Power is provided mainly from natural gas fired plants, which can come on line and spin up to speed within minutes.
There are two distinct peaks on that winter diagram. In the morning — breakfast, showers, turns on the heaters etc – and then again in the afternoon and evening — when people come home and turn on the heaters, stoves, microwaves, washing machines and dryers.
Without rearranging our biological clocks, or reforming our civilization, there’s no real possibility of ‘flattening out’ the two humps.
Renewable power just cannot fill those unmovable daily time-slot requirements.
Let’s look at the Base Load. We are told that Concentrating Solar (CS) can do this, but it just cannot.
A CS power plant currently can in theory supply a maximum of 50MW, but even now the best plant in operation only provides 17MW. Let’s pretend it can do 50MW. These plants are ones that have heat retention and can supply their power after the Sun sets, but the best case year-round-average is around 16 hours a day. And in winter, when the peaks are highest, there may only be 4 hours a day when sunlight is strong enough to use.
Base load is 18,000MW, so we need at least 360 best case CS plants. They cost around $1.45 billion each, so around $520 billion for construction — and still you have an average of 8 hours in every day without incoming power to run Australia.
Wind power can provide some power throughout the day, but their average 8 hours a day of maximum delivery is usually not the right 8 hours. In eastern Australia, the total power delivered by the 23 wind plants with 965 huge towers is still only 600MW, or around 3.3% of Base Load.
While there are people who will tell you that concentrated solar and wind power can power eastern Australia, it looks impossible once you dig down to the details.
Source for Load Curve Diagrams: Third graph on each page
Summer Jan 30 2012 http://windfarmperformance.info/?date=2012-01-30
Winter Jul 22 201 http://windfarmperformance.info/?date=2011-07-22
******************************************************
The short killer summary: The Skeptics Handbook. The most deadly point: The Missing Hot Spot
http://en.wikipedia.org/wiki/Quad_(unit)
A quad is a unit of energy equal to 1015 (a short-scale quadrillion) BTU,[1] or 1.055 ¥ 1018 joules (1.055 exajoules or EJ) in SI units.
[/snip]
One example from wiki-wacky is that 8,007,000,000 gal of gas equals one quad, that’s over 190 million barrels. Most of our electricity still comes from coal; next largest is (I suspect) the fast-growing use of natural gas; hydroelectric sources account for a smaller percentage than it did in 1970, although I think the overall output has risen.
We use a *lot* of electricity, it’s measured in quads (), sez here (different page) in 2010 the US sucked down 97.8 quads.
Thanks Ernest.
Was just watching excellent Rep. Darrel Issa hearing on BoL (labor).
Minor point slipped by on requirement for them to report numbers of ‘green jobs’.
Turns out that If a plumber installs a lo-flo toilet... green job.
A mechanic works on brakes on a hybrid city bus... green job.
Driver of hybrid city bus... green job. Same bus, same route but if they swap to hybrid bus... green job.
Repeat...
Is someone reporting on this?
Disclaimer: Opinions posted on Free Republic are those of the individual posters and do not necessarily represent the opinion of Free Republic or its management. All materials posted herein are protected by copyright law and the exemption for fair use of copyrighted works.