Skip to comments.
East Anglia Climatic Research Unit shown to be liars by ... latest FOIA ruling and investigation
watts up with that? ^
| Anthony Watts
Posted on 05/08/2012 9:43:35 AM PDT by Ernest_at_the_Beach
This will be a top sticky post for a day or two – new stories appear below this one.
In the over 7,000 published stories here on WUWT, I have never used the word “liar” in the headline to refer to CRU and the Yamal affair. That changes with this story.
I’ve always thought that with CRU, simple incompetence is a more likely explanation than malice and/or deception. For example, Phil Jones can’t even plot trends in Excel. In this particular case, I don’t think incompetence is the plausible explanation anymore. As one commenter on CA (Andy) said
“I suspect the cause of all this is an initial small lie, to cover intellectual mistakes, snowballing into a desire not to lose face, exacerbated by greater lies and compounded by group think. “
Given what I’ve witnessed and recalled from the history of the Yamal affair with Steve McIntyre’s latest investigation, I’m now quite comfortable applying the label of “liar” to the CRU regarding their handling of data, of accusations, and of FOIA.
In my opinion, these unscrupulous climate scientists at CRU deserve our scorn, and if UEA had any integrity, they’d be reprimanded and/or shown the door. But as we’ve seen with the handling of the Muir Russell sham “investigation”, key questions to key players weren’t even asked about key points of evidence. For example, Muir Russell didn’t even bother attending the one interview (April 9) in which Jones and Briffa were supposed to be asked about paleoclimate. So UEA/CRU will probably just try to gloss this over with another lie too. – Anthony Watts
McIntyre: Yamal FOI Sheds New Light on Flawed Data
(Excerpt) Read more at wattsupwiththat.com ...
TOPICS: Conspiracy; Science; Weather
KEYWORDS: climatechange; climategate; climategate2; fakegate; gleick; globalwarming; globalwarminghoax; heartlandinstitute; hockeysticktemps; yamal
Navigation: use the links below to view more comments.
first 1-20, 21-24 next last
To: TigerLikesRooster; landsbaum; Signalman; NormsRevenge; steelyourfaith; Lancey Howard; ...
To: Ernest_at_the_Beach
I wonder if ‘FOIA’ will be back to reveal the code to the encrypted file? Or release the rest of them?
3
posted on
05/08/2012 9:51:41 AM PDT
by
RushIsMyTeddyBear
(A MUST WATCH: http://www.youtube.com/watch?feature=player_embedded&v=KeOLurcQaqI)
To: RushIsMyTeddyBear
Who knows.....
To: All
From the article:
*******************************************EXCERPT*************************************
The Relevance of Yamal
The Yamal chronology is relevant both because, since its introduction in 2000, it has been used in virtually all of the supposedly “independent” IPCC multiproxy studies (see an October 2009 discussion here) and because it is particularly influential in contributing an HS-shape to the studies that do not use bristlecones.
***********************************************************
Editing NOTE:
HS-shape = Hhockey Stick Shape
*******************************************
IPCC AR4 Box 6.4 showed the eight proxies which have been used the most repetitively (this wasn’t its intent.) Of these eight proxies, Briffa’s Yamal (labelled “NW Russia”) is shown with the biggest HS blade, larger even than Mann’s PC1 (labelled here as “W USA”). See here) and tag yamal.
Figure 1. Yamal Chronology in IPCC AR4 Box 6.4. Labelled as “NW Russia”
In previous posts, I’ve satirized the “addiction” of paleoclimatologists to bristlecones and Yamal as, respectively, heroin and cocaine for climatologists. (In pharmacological terms, upside-down Tiljander would be, I guess, LSD, as the psychedelic Mann et al 2008 is indifferent as to whether proxies are used upside-down or not (cue Jefferson Airplane‘s insightful critique of Mannian statistics.)
Although Yamal and Polar Urals had been long-standing topics at Climate Audit, they first attracted wide attention in late September 2009, when measurement data became available for the three “regional chronologies” of Briffa et al 2008 (Taimyr-Avam, Tornetrask-Finland and Yamal).
To: All
To: All; TigerLikesRooster; landsbaum; Signalman; NormsRevenge; steelyourfaith; Lancey Howard; ...
To: Ernest_at_the_Beach
A Register article is referenced in the Climate Audit article linked above:
Treemometers: A new scientific scandal
******************************************EXCERPT************************************
If a peer review fails in the woods...
By Andrew Orlowski • Get more from this author
Posted in Energy, 29th September 2009 16:03 GMT
A scientific scandal is casting a shadow over a number of recent peer-reviewed climate papers.
At least eight papers purporting to reconstruct the historical temperature record times may need to be revisited, with significant implications for contemporary climate studies, the basis of the IPCC's assessments. A number of these involve senior climatologists at the British climate research centre CRU at the University East Anglia. In every case, peer review failed to pick up the errors.
At issue is the use of tree rings as a temperature proxy, or dendrochronology. Using statistical techniques, researchers take the ring data to create a "reconstruction" of historical temperature anomalies. But trees are a highly controversial indicator of temperature, since the rings principally record Co2, and also record humidity, rainfall, nutrient intake and other local factors.
Picking a temperature signal out of all this noise is problematic, and a dendrochronology can differ significantly from instrumented data. In dendro jargon, this disparity is called "divergence". The process of creating a raw data set also involves a selective use of samples - a choice open to a scientist's biases.
Yet none of this has stopped paleoclimataologists from making bold claims using tree ring data.
In particular, since 2000, a large number of peer-reviewed climate papers have incorporated data from trees at the Yamal Peninsula in Siberia. This dataset gained favour, curiously superseding a newer and larger data set from nearby. The older Yamal trees indicated pronounced and dramatic uptick in temperatures.
How could this be? Scientists have ensured much of the measurement data used in the reconstructions remains a secret - failing to fulfill procedures to archive the raw data. Without the raw data, other scientists could not reproduce the results. The most prestigious peer reviewed journals, including Nature and Science, were reluctant to demand the data from contributors. Until now, that is.
At the insistence of editors of the Royal Society's Philosophical Transactions B the data has leaked into the open - and Yamal's mystery is no more.
From this we know that the Yamal data set uses just 12 trees from a larger set to produce its dramatic recent trend. Yet many more were cored, and a larger data set (of 34) from the vicinity shows no dramatic recent warming, and warmer temperatures in the middle ages.
In all there are 252 cores in the CRU Yamal data set, of which ten were alive 1990. All 12 cores selected show strong growth since the mid-19th century. The implication is clear: the dozen were cherry-picked.
(This oversimplifies the story somewhat: for more detail, read this fascinating narrative by blogger BishopHill here.)
To: All
Going to the Bishop Hill article see link at post #8.
*********************************EXCERPT*****************************************
Sep 29, 2009
The Yamal implosion
There is a great deal of excitement among climate sceptics over Steve McIntyre's recent posting on Yamal. Several people have asked me to do a layman's guide to the story in the manner of
Caspar and the Jesus paper. Here it is.
The story of Michael Mann's Hockey Stick reconstruction, its statistical bias and the influence of the bristlecone pines is well known. McIntyre's research into the other reconstructions has received less publicity, however. The story of the Yamal chronology may change that.
The bristlecone pines that created the shape of the Hockey Stick graph are used in nearly every millennial temperature reconstruction around today, but there are also a handful of other tree ring series that are nearly as common and just as influential on the results. Back at the start of McIntyre's research into the area of paleoclimate, one of the most significant of these was called Polar Urals, a chronology first published by Keith Briffa of the Climate Research Unit (CRU) at the University of East Anglia. At the time, it was used in pretty much every temperature reconstruction around. In his paper, Briffa made the startling claim that the coldest year of the millennium was AD 1032, a statement that, if true, would have completely overturned the idea of the Medieval Warm Period. It is not hard to see why paleoclimatologists found the series so alluring.
 Keith BriffaSome of McIntyre's research into Polar Urals deserves a story in its own right, but it is one that will have to wait for another day. We can pick up the narrative again in 2005, when McIntyre discovered that an update to the Polar Urals series had been collected in 1999. Through a contact he was able to obtain a copy of the revised series. Remarkably, in the update the eleventh century appeared to be much warmer than in the original - in fact it was higher even than the twentieth century. This must have been a severe blow to paleoclimatologists, a supposition that is borne out by what happened next, or rather what didn't: the update to the Polar Urals was not published, it was not archived and it was almost never seen again.
With Polar Urals now unusable, paleclimatologists had a pressing need for a hockey stick shaped replacement and a solution appeared in the nick of time in the shape of a series from the nearby location of Yamal.
**************************************SNIP*****************************************
McIntyre therefore prepared a revised dataset, replacing Briffa's selected 12 cores with the 34 from Khadyta River. The revised chronology was simply staggering. The sharp uptick in the series at the end of the twentieth century had vanished, leaving a twentieth century apparently without a significant trend. The blade of the Yamal hockey stick, used in so many of those temperature reconstructions that the IPCC said validated Michael Mann's work, was gone.

[Updated 30/9/09 to correct minor dating issue. Also removed the reference to KB's illness which is apparently genuine]
To: All
From WUWT:
*************************************
170 Responses to East Anglia Climatic Research Unit shown to be liars by results of latest FOIA ruling and investigation
To: Ernest_at_the_Beach
ClimateGate III.
For once, I can enjoy watching a sequel!
11
posted on
05/08/2012 11:00:52 AM PDT
by
Carry_Okie
(The environment is too complex and too important to manage by central planning.)
To: Carry_Okie
Thanks for the reply...I was beginning to think I was talking to myself....
To: All
From the comments:
*********************************EXCERPT****************************************
Robert M says:
I’ll have to digest what Steve has written, but if it makes Anthony release his hope that “The Team” is incompetent rather then criminal, it must be good!!!
To: All
More:
****************************EXCERPT********************************************
Peter Kovachev says:
I’ve said it before elsewhere and I’ll say it again: When a party produces errors consistently to its own advantage, the chances that they are true errors dimish with each case.
14
posted on
05/08/2012 11:09:16 AM PDT
by
Ernest_at_the_Beach
(The Global Warming Hoax was a Criminal Act....where is Al Gore?)
To: All
More:
************************************EXCERPT***********************************************
Peter Miller says:
I have just read Steve’s article twice. An excellent piece of research, no wonder UEA did not want to release any of this data.
The term “Liars” might be a little on the strong side, “purveyors of deceit, manipulation and misinformation” might be a little more appropriate.
It will be amusing to see what our regular alarmist contributors have to say about this.
I would like to see Steve get stuck into Crutem4 to see what he can uncover in the way of deceit, manipulation and misinformation.
15
posted on
05/08/2012 11:14:03 AM PDT
by
Ernest_at_the_Beach
(The Global Warming Hoax was a Criminal Act....where is Al Gore?)
To: All
More:
*************************************EXCERPT************************************
Streetcred says:
Having read Steve McIntyre’s article there can be no denying that the University of Easy Access’ CRU is populated with pathological liars and that the Climategate ‘investigations’ by their pals were nothing more than a dishonest whitewash.
16
posted on
05/08/2012 11:17:04 AM PDT
by
Ernest_at_the_Beach
(The Global Warming Hoax was a Criminal Act....where is Al Gore?)
To: All
More:
***********************************EXCERPT***************************************
17
posted on
05/08/2012 11:19:22 AM PDT
by
Ernest_at_the_Beach
(The Global Warming Hoax was a Criminal Act....where is Al Gore?)
To: All
Doing my favorite thing....pursuing links...from post just above:
THE WEST IS FACING A NEW SEVERE RECESSION....
***********************************************
CLEAN ENERGY PUNDIT
CLEAN ENERGY is energy that is limitless in availability, is ubiquitous, is pollution free, is capable to provide source to use proximity, empowers rural populations, does not deplete food, forest or water resources, does not deplete biomass, and does all that for generations to come. The challenge is to propagate and implement CLEAN ENERGY production throughout 1st, 2nd, 3rd and 4th(Favelas) Worlds, employing all its technological, humanist and democratic dimensions.
Tuesday, 4 October 2011
THE WEST IS FACING A NEW SEVERE RECESSION....
18
posted on
05/08/2012 11:31:21 AM PDT
by
Ernest_at_the_Beach
(The Global Warming Hoax was a Criminal Act....where is Al Gore?)
To: All
From JoNova website:
Key Links in the Global Warming Debate
**************************************************
Key Links in the Global Warming Debate
The Science of CO2 and Temperature
Albedo
- Over the whole surface of the Earth, about 30 percent of incoming solar energy is reflected back to space. [NASA]
Benefits of Carbon Dioxide
Back to Top
Blogs -Most detailed
Back to Top
CO2
There are many different ways to measure the temperature. JunkScience.com publishes the most up to date graphs from the primary sources (and lists the link to the data at the top of each graph.)
- RSS Globe: Remote Sensing Systems in California. Uses only satellite data.
- UAH: University of Alabama in Huntsville. Uses only satellite data.
- HadCrug: The Hadley Centre in the UK uses a mix of satellite data and land-based thermometers.
- GissGlobal: The Goddard Institute for Space Studies (GISS) at NASA uses land-based thermometers (plus a few ocean thermometers), but no satellite data.
- Graphs of Southern Hemisphere versus Northern Hemisphere warming, Climate Audit
- CO2 levels at Mauna-Loa Hawaii. Data.
- Central England Temperature Graph, 1650 -2000
- Reconstruction of air temperatures in Eastern Europe based on Lambs Winter Severity Index.
- Half a billion years of CO2 and temperatures. Scotese and Berner GRAPH & Here
- Description of the Holocene Optimum (Uni of Arizona Lecture).
- Graph of temperatures since the last ice age.
- Western Australia temperature records
- Plot your own graphs at WoodForTrees.org.
- Carbon rose 3000 years after temperatures in the PETM 50 million years ago. Sluijs et al. 2007
- Half life of CO2. Graph comparing studies.
- Hubert Lambs‘ reconstruction of the last 1000 years.
Back to Top
Greenhouse Gas Theory
- Falsification Of The Atmospheric CO2 Greenhouse Effects Within The Frame Of Physics Link. It quotes the 1909 experiment with the two greenhouses, one normal the other with glass transparent to infra red.
- Hans Schreuder I love my Carbon dioxide the greenhouse gas effect is not just not significant, it is not possible
- Similarly Will Alexanders article takes a broader and more holistic view and seems to be stating similar conclusions about the greenhouse effect’s non-existence.
- Miskolczi’s 2007 paper, see here for commentary.
- Michael Hammers discussion of radiative energy budget on Jennifer Marohasy’s site is here. He suggests that the amount of feedback attributed to water vapor in the models is impossible and explains why using at least two different methods.
- The Log Graph of carbon dioxide absorption on p 8 of The Skeptics Handbook comes from David Archibald: The Past and Future of Climate (Pdf).
- The history of scientific papers AGWObserver. Arrhenius 1896, Gebhart 1966.
- The IPCC and NASA both admit they don’t understand water vapor: NASA 1997
Back to Top
Missing hot spot (due to lack of feedback – see also feedback)
- My summary, and response to claims that ‘it’s been found”.
- Signatures of different causes of warming see page 25. CCSP report 2006.
- Radiosonde recorded temperatures in atmospheric temperatures for 1979 – 1999. US CSSP published the graphic summary in part E of Figure 5.7 on page 116 in 2006
- A variation of the signatures of different causes of warming are also graphed in IPCC Assessment Report 4, 2007, Chapter 9, Figure 9.1, page 675
- Dr David Evans has summarized the explanation and evidence here for the Missing Greenhouse Signature.
- SPPI reports on the missing signature Greenhouse Warming? What Greenhouse Warming? August 2007. Christopher Monckton. (16 page pdf file).
- Fallacies about Global warming John McLean SPPI (8 page pdf). This covers the historic methods of recording temperatures, the meaning of peer reviewed papers, measuring global temperatures, the ‘consensus’, whether trends in temperature means anything and the accuracy of climate models. Its especially strong discussing the nature of the IPCC and it’s ‘scientific’ standing, or not.
- Statistics of radiosonde errors: Debate at climate audit and the opposite view at real climate.
- Santer’s 2008 paper and some discussion.
- Allen and Sherwood’s paper, and some commentary. There’s another Sherwood paper from 2008 that people quote but which didn’t find the hot-spot, the official AMS entry and the RC commentary. Sherwood’s UNSW site. The AMS paper from 2007 where Allen and Sherwood suggest wind-shear is a good way to analyze temperatures.
- All of my posts on the topic.
- Assorted Papers: Sneider, Kurtman, Lindzen 1999 [PDF], Slingo 1999 [PDF], Held and Soden 2000 [PDF], Lindberg 2002 [PDF], Bony 2003 [PDF], Douglass 2007 [PDF]
Back to Top
Ice cores
- Ice Core CO2 data: Carbon Dioxide Information Analysis Center, CDIAC
- Callion’s 2003 paper detailing the 800 year lag for the first time.
- Lorius on Climate Sensitivity in ice cores in 1990 Review.
- See Palisad for the most informative detailed graphics on what the Vostok and Dome Ice cores mean and why they strongly mathematically suggest CO2 follows temperatures and has little effect on them.This is what you need to see to understand “feedback” or the postulated “amplification”.
- A colorful but informative and link-filled presentation is here.
- See the lag for yourself. My large graphs of the full 420,000 years of Vostok data is here.
- Sea Ice current extent data here.
- Discussion of ice cores, questioning reliability of CO2 estimates here. 1997
Back to Top
Feedback Loops
Back to Top
Hockey Stick Graph
- Good summary from the Ross McKitrick who uncovered Mann’s fraud 2005 overview and a 2008 speech with up to date extras.
- The Australian Department of Climate Change still sports the hockey stick on its website in 2008. ( Ahhh. Maybe they got the message. It’s gone now in 2009. I’ll try to find an archive version.)
- The Medieval Warming Period: What the combined mass of independent researchers say about the historical past in 2007 is in Figure 3 (the last blue downtick seems to be due to using 30 year averages with the last period ending in about 1975, the end of the last cooling).
- Hockey Stick? What Hockey Stick? This long pdf goes right through the Mann-McIntyre saga, then lists graph after graph of observations around the world over the last millenia that supports the idea that the Medieval Warming Period was real.
- Mann Bradley Hughes 1998 abstract, PDF, Correngium (2004)
- Briffas Hockey Stick. My summary; Climate Audit; Watts Up; Real Climate; A Reply to Real Climate; Briffas’ reply; (CA reply to Briffa); Yamal06 - the most influential tree.
- Andrew Bostom‘ summary: “Horse Hockey Climate Scientology” Dec 2008.
- Wegman Report 2006. ( Back up)
- McIntyre and McKitrick: Corrections to Mann 2003; Hockey Sticks, Principal Componants, & Spurious Significance 2005; M&M Critic and update 2005.
- David Deming on that email “get rid of the MWP”".
- Story in Dutch Magazine in 2005 Natuurwetenschap & Techniek.
Back to Top
Miskolczi
- Optical Depth, the greenhouse effect
The best collection of information is the Medieval Warming Period Data base and Map at CO2science.org. (Look at that map, it’s animated.)
- Temperature reconstructions -
Back to Top
Oceans (see also Water)
Oceans (Acidification)
- Murray Darling River runoff and rainfall 1895 – 2010 (CSIRO)
Back to Top
Science (Method and philosophy)
Back to Top
Sea Ice
Back to Top
Solar-Magnetic Theory
- Solar cycles 24 and 25 and predicted climate response, David Archibald. Energy & Environment, Volume 17, Number 1, January 2006 , pp. 29-35(7). See also The Past and Future of Climate (Pdf).
- “Solar Cycle 24 Why the world will continue cooling and why carbon dioxide won’t make a detectable difference”. David Archibald, (2008, 70 page book)
- The Chilling Stars: The New Theory of Climate Change by Henrik Svensmark, Totem Books 2007.
- Reply to Lockwood and Frohlich by Svensmark 2007
- Falls in cosmic rays affect low clouds Svensmark 2009
- Alexander: Linkages between solar activity, climate predictability and water resource development
Storms (Hurricanes and Cyclones)
Back to Top
Summary Documents
- Overall 2008 summary (50 page pdf) by the Non-governmental International Panel on Climate Change.
- 2009 NIPCC (Non Governmental International Panel of Climate Change). Check here for the latest detailed comprehensive report. 8Mb!
- Monthly reports by SPPI. See the latest graphs on CO2, Temp, Oceans and Ice.
- An excellent summary and collection of relevant graphs by Friends of Science
- see also Greenhouse Gas Theory (below).
- Environmental Effects of Increased Atmospheric CO2, Robinson, Robinson, & Soon. Excellent 12 page summary.
- There is No Evidence, David Evans summary pdf.
- There is no evidence (that answers the question) in the IPCC Assessment Report 4 Chapter Nine. AR4, Ch 9.
- Is the US Surface Temperature Record Reliable? Watts report.
- Projecting Australian climate change – Technical Report by the CSIRO 2006
Back to Top
Thermometers, Siting and Data
Back to Top
Venus
There is no greenhouse effect on Venus with temperature, pressure and Stephan Boltzman to calculate with.Volcanoes
Back to Top
EPA regulations
Back to Top
The ‘consensus’
- Two Nobel Physics Prizewinners,
- Four elite Astronauts,
- 1000 scientists dispute the AGW theory. Marc Morano’s list on the US Senate site. Over 200 pages of names, credentials, and statements.
- 30,000 scientists don’t agree that global warming is caused by man-made carbon dioxide, including 9,000 PhD’s.
There is no convincing scientific evidence that human release of carbon dioxide, methane, or other greenhouse gases is causing or will, in the foreseeable future, cause catastrophic heating of the Earths atmosphere…”
The Petition Project
- Poptech defends Frederick Seitz and Art Robinson in detail. A great resource.
- A Canadian survey of more than 51,000 specialists in the Association of Professional Engineers, Geologists and Geophysicists of Alberta showed 68 per cent disagree with the popular statement that “the debate on the scientific causes of recent climate change is settled.”
- The Consensus. What consensus? John McLean. (See also IPCC)
Back to Top
The IPCC
Back to Top
Energy
- Key world energy statistics 2008 IEAE
- History of energy use since 10,000 B.C. book review
- US Dept of Energy (DOE). Energy Sources fossil fuels = 85%.
- Energy Information Administration (EIA). Energy consumption by fuel type Highlights. Energy by country by year
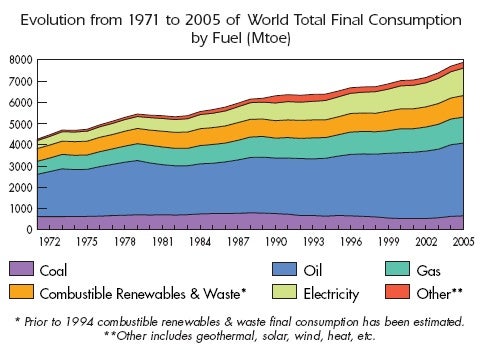
- Total Fuel consumption 1971 – 2005 Mtoe.
- Energy Consumption from 1860 -2000 graph, from page.
Logic and Reason
How fallacious arguments are used for political or personal advantage
Dr Sanity – on logical strategies used by on narcisissm
- “United Nations. It’s your world. We just want to own you”. unisevil
Monetary Theory
- Climate Science Technology Program CSTP
- Climate Change Science Program CSSP. 2009 report “Our changing planet”
- Australian government ARC funding from 2004-2009: Senate Estimates
Back to Top
Spin doctored
———————————
Good luck, it’s a deep pool.I’m happy to consider suggestions, and will update this list page regularly. But I’m only looking for The Best, The Original, or very notable contributions. I’m not trying to emulate the 4,000-climate-links-pages. Apologies to all the good contributions out there which are not listed here. Email me joanne ‘AT’ joannenova.com.au
Last update Dec 21, 2011
Skeptics Handbook artwork and downloadable files Here
VN:F [1.9.13_1145]
19
posted on
05/08/2012 11:56:25 AM PDT
by
Ernest_at_the_Beach
(The Global Warming Hoax was a Criminal Act....where is Al Gore?)
To: RushIsMyTeddyBear
See the updates to the thread.
Got more work to do.
20
posted on
05/08/2012 11:58:44 AM PDT
by
Ernest_at_the_Beach
(The Global Warming Hoax was a Criminal Act....where is Al Gore?)
Navigation: use the links below to view more comments.
first 1-20, 21-24 next last
Disclaimer:
Opinions posted on Free Republic are those of the individual
posters and do not necessarily represent the opinion of Free Republic or its
management. All materials posted herein are protected by copyright law and the
exemption for fair use of copyrighted works.
FreeRepublic.com is powered by software copyright 2000-2008 John Robinson

