Skip to comments.
Mish Unemployment Projections Through 2020 - It Looks Grim
Mish's Global Economic Trend Analysis ^
| Mike "Mish" Shedlock
Posted on 11/14/2009 8:24:06 AM PST by BGHater
Inquiring minds are interested in figuring out how long it might take to get back to "full employment" defined as 5%.
John Mauldin touched upon this theme in Welcome to the New Normal.
John's analysis stopped short of making actual projections as to when full employment would return, or the detailed path it would take to get there year by year. However, I thank John for providing a nice starting point for discussion.
In Scarred Job Market Expected to Weigh on Economy The Wall Street Journal offers this look at how long it would take to return to employment levels before the start of the recession. Please consider the long road back.
The Long Road Back

Click On Any Chart In This Post For Sharper Image
The Journal states ...
"On average, the economists don't expect unemployment to fall below 6% until 2013"
The Journal goes on ...
"On average the economists -- not all of whom answered every question -- expect the unemployment rate to peak at 10.2% in February. But even once the employment situation stops getting worse, economists expect recovery to come slowly. "It could take until 2014-15 before we see a 5% handle on unemployment again," said Diane Swonk at Mesirow Financial."
6% by 2013?!
5% by 2015?!
Really?
Mapping Unemployment
To map unemployment projections year-by-year from now through 2020 there are a huge number of variables to take into consideration.
Factors Affecting Unemployment Projections
- Current Hiring Trends
- Demographics
- Working Age Population Growth Projections
- Boomer Retirements
- Participation Rate
- Part-Time Employment
- Drivers For Jobs
- Housing
- Commercial Real Estate
- Global Wage Arbitrage
- Outsourcing
- Double Dip Recession
- Productivity
- Manufacturing
Let's start our analysis with a look at monthly job growth trends from 1999 through 2009. John Mauldin posted the following chart, I filled in averages and outlined in blue previous recession periods.
Monthly Job Growth 1999-2009
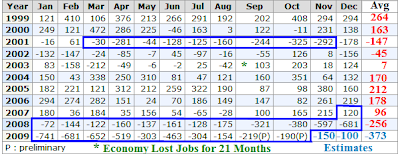
Chart courtesy of BLS. Annotations by me, numbers are in thousands.
The areas in deep blue mark recessions. The last recession ended in November, 2001. The economy shed jobs for the next 21 months. Is there any reason for it to be different this time?
- At the height of the internet bubble with a nonsensical Y2K scare on top of that, the economy managed to gain 264,000 jobs a month.
- At the height of the housing bubble in 2005, the economy added 212,000 jobs a month.
- At the height of the commercial real estate bubble with massive store expansion, the economy added somewhere between 96,000 and 178,000 jobs per month depending on where you mark the peak.
Neither the housing boom, nor the commercial real estate boom is coming back. Nor is there going to be another internet revolution. If anything, outsourcing of internet jobs to Asia is likely to remain intense.
Finally, consider all the financial engineering jobs, banking jobs etc, that are not coming back.
No Genuine Driver For Jobs.
- The retail sector has massive overcapacity. We do not need more Home Depots, WalMarts, Lowes, Sears, Pizza Huts, Targets, Safeways, etc etc.
- Commercial real estate is flooded with vacant offices and plagued by falling rents.
- Housing inventory is enormous.
- Boomers will be looking to downsize their lifestyles.
- There is not going to be another internet boom.
What about manufacturing? As an imperfect proxy for manufacturing, let's take a look at light vehicle sales and employment.
Motor Vehicle Sales
Calculated Risk has this interesting chart of Light Vehicle Sales.

Notice the huge recent spike caused by cash-for-clunkers that has since been given back. Are auto sales going back to where they were? I don't think so? In terms of jobs, will it matter even if they do?
The Department of Energy has an interesting chart on Declining Automotive Manufacturing Employment.
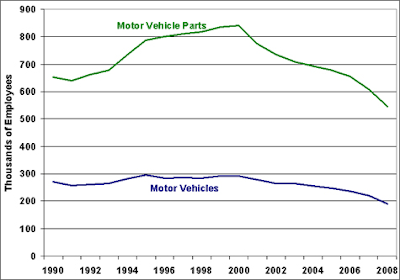
Those automotive and auto parts jobs are gone for good regardless of whether or not sales increase.
Peak Growth In Jobs Is In
The peak growth in jobs, based on an analysis of jobs that are never coming back is clearly in.
- The internet boom peaked at 264,000 jobs per month in 1999.
- The housing bubble boom peaked at 212,000 jobs per month in 2005.
- The commercial real estate boom peaked at 178,000 jobs per month.
- The next peak will be lower yet.
Let's be generous and suggest 150,000 jobs per month for an entire year at the peak of the next cycle. That is actually exceptionally generous given we have not yet taken into consideration boomer demographics, part-time jobs, the participation rate, and other such factors.
Current Picture
Please consider the October 2009 Employment Report including household data, the civilian labor force, the unemployment rate, part-time employment, and trends in the participation rate.
Table A Household Data October 2009

The civilian labor force is 153,975,000.
82,575,000 are not in the labor force.
Those base numbers will be used in charts a bit later.
Table A-12
Table A-12 is where one can find a better approximation of what the unemployment rate really is. Let's take a look

click on chart for sharper image
Grim Statistics
The official unemployment rate is 10.2% and rising. However, if you start counting all the people that want a job but gave up, all the people with part-time jobs that want a full-time job, all the people who dropped off the unemployment rolls because their unemployment benefits ran out, etc., you get a closer picture of what the unemployment rate is. That number is in the last row labeled U-6.
It reflects how unemployment feels to the average Joe on the street. U-6 is 17.5%. Both U-6 and U-3 (the so called "official" unemployment number) are poised to rise further although most likely at a slower pace than earlier this year.
For the purpose of this post, I will be charting and predicting U-3 the official unemployment number.
Table A-5 Part Time Status

click on chart for sharper image
The chart shows there are 9.28 million people are working part time but want a full time job. A year ago the number was 6.8 million.
Note the trend in part-time work. It is inching up. In a recovery it should be headed down quickly. The reason is employers increase the hours of part-time workers before they start hiring full-time workers.
The key take-away from this series are the millions of workers whose hours will rise before companies start hiring more workers.
Table B-2. Average weekly hours of production and nonsupervisory workers on private nonfarm payrolls

Table B-2 is another measure of part-time employment. Companies will expand workweeks to 40 hours and even add a bit of overtime before hiring new employees.
The current workweek is down to 33 hours. That represents a lot of people who will not be hired as the economy picks up steam.
Population Estimates
According to the Census Bureau Population Estimates we are going to add about 2.5 million working age (16 years old and up) citizens a year from now until 2020.
The numbers varies slightly year to year. I used an estimate of the average summing up the buckets from 16 to 100+ for the years in question and rounding the result.
Civilian Participation Rate
The participation rate is a measure of how many of those aged 16 and older are working vs. the entire pool of those 16 and older.
The participation rate soared from 1960 to 1990 as women started working and two wage earner families became the norm as the following table shows.
Year   Men    Women
1960   83.3   37.7
1970   79.7   43.3
1980   76.3   51.5
1985   76.3   54.5
1990   76.1   57.5
As boomers head into retirement the participation rate should be expected to decline.
The participation rate is also affected by those wanting work but not actively seeking work. The difference between U-5 and U-3 in Table A-12 above shows the effect of a falling participation rate.
In theory, economists claim the participation should rise as the economy recovers on grounds that people who want jobs but stopped looking will again start looking.
Theory is one thing and practice is another as the following charts show.
Participation Rate 1950-Present

Civilian Participation Rate Detail

So much for theory about participation rates rising as a recovery starts.
If history repeats, expect the participation rate to keep declining after this recession ends. Then because of demographic trends of boomer retirement, I expect the participation rate to continue declining through 2020.
Table A-1 Employment Status

Table A1 shows the civilian noninstitutional population (those over 16 not in prisons), the participation rate, unemployment rate, employed, those not in the labor force, and those who want a job. Those numbers form starting numbers for the charts below.
Unemployment Classifications
People are classified as employed if they did any work at all as paid employees during the reference week; worked in their own business, profession, or on their own farm; or worked without pay at least 15 hours in a family business or farm. People are also counted as employed if they were temporarily absent from their jobs because of illness, bad weather, vacation, labor-management disputes, or personal reasons.
People are classified as unemployed if they meet all of the following criteria: They had no employment during the reference week; they were available for work at that time; and they made specific efforts to find employment sometime during the 4-week period ending with the reference week.
Past Predictions
Past history does not guarantee future results but let's take a look at who said what, when.
Wednesday, April 22, 2009: Leaking and Reeking of Stress
Note that the adverse scenario assumes a 10.3% unemployment rate at the end of 2010. Hells bells, it's highly likely unemployment far exceeds 10.3% before the end of 2009.
Sunday, June 07, 2009: Optimistic Unemployment and Housing Forecasts Looking Downright Silly
Economics may be the "dismal science" but economists as a group sure seem to be an optimistic lot.
The consensus forecast of unemployment for 2009 was 8.4%. The Blue Chip Forecast, a survey of America's leading business economists that costs $875 annually. Blue Chip had the unemployment rate at 8.3% for 2009 and 8.7% for 2010.
the Fed had a mere 10% chance the unemployment numbers get as high as the adverse scenario. The adverse scenario for 2009 has already been exceeded unless you think unemployment has peaked and is going lower over the next several months.
Meanwhile the Survey of Professional Forecasters pegged the unemployment rate at 8.4% for 2009 and 8.8% for 2010 (now revised much higher as is always the case).
Across the board, the Fed's adverse scenarios were a cakewalk, especially the unemployment forecasts.
Friday, October 02, 2009: Jobs Contract 21th Straight Month; Unemployment Rate Hits 9.8%
Sorry folks, I was one month early. In January I forecast the unemployment rate would hit 9.8% by August. Meanwhile, even though it was clear the Fed was wildly off base in its adverse scenario, the Fed upped it total to a mere 9.2% to 9.6% for the year as noted on May 21, 2009 in Fed's Economic Forecast Worsens; Still Ridiculously Optimistic.
The Fed's forecasts, released as part of the minutes from its April meeting, show that its staff now expects the unemployment rate to rise to between 9.2% and 9.6% this year. The central bank had forecast in January that the jobless rate would be in a range of 8.5% to 8.8%, but the unemployment rate topped that in April, hitting 8.9%.
Assumptions
In light of all of the above...
- Job losses are likely to continue for a minimum of another year.
- When job gains start, they will be very slow at first, then pick up.
- An extremely generous monthly job gain stat over the course of the year would be 150,000 jobs.
- A falling participation rate will continue to mask reported unemployment.
- Starting in 2013 the labor pool will start decreasing because of boomer demographics.
- The noninstitutional population will rise by 2.5 million workers a year
Historical Recap
Currently the official unemployment rate is at 10.2%
Past history shows unemployment will keep rising for another year, perhaps 2 years even as the economy begins to add jobs.
Labor Pool Analysis
Labor pool analysis is somewhat tricky analysis because it is governed by two variables: demographics and the participation rate.
As discussed above, it is hard to know if and when discouraged workers will re-enter the workforce. Meanwhile, boomer demographics alone suggests the rate of change in the labor pool will start declining at an accelerated pace starting somewhere between 2013-2015.
Together the number of jobs it will take to keep the unemployment rate steady will decline from now until 2020.
Dave Rosenberg's Outlook
In Breakfast with Dave on November 11, Dave Rosenberg says "U.S. Unemployment Rate Headed For 12.0-13.0%."
I think that is a reasonable estimate but let's take a more optimistic viewpoint that unemployment will peak between 11-12%.
Scenario Number One
Somewhere along the line I called for unemployment to peak at about 11.5% so for the sake of this analysis let's keep that approximate target in mind as one distinct possibility.
Let's also assume that unemployment will peak in December 2011 about 2 years from now.
This is what scenario number one looks like

Unemployment Scenario 1 Data

Click On Any Chart In This Post For Sharper Image
Notes:
The unemployment rate is defined as the Number of Unemployed / Labor Pool
The Base Labor Pool number 153.98 million is from the BLS
The Labor Pool Population increases by 2.5 million a year
Jobs and the monthly labor pool numbers are estimated
Extremely Generous Assumptions
- I am assuming there will be job gains (on average) in 2010 even though history suggests otherwise.
- I have the number of jobs gained per month increasing to 170,000 jobs per month for 2013 even though I think 150,000 is a more realistic maximum target for an entire year.
- I have +150,000 jobs for 4 consecutive years through 2016.
- I have the Labor Pool decreasing dramatically as a result of boomer demographics starting in 2014.This acts to lower the unemployment rate.
- I have the participation rate falling every year, accelerating rapidly starting in 2014 all the way through 2020.
Labor Pool, Jobs, Participation Rate Projections

I was going to map a scenario number 2 that includes a double dip recession but I do not want to frighten everyone to death.
Bear in mind that I think a double dip recession is very likely. Alternatively, we just ramble along for years. Moreover, even if we do not have a double dip, the odds of a second recession at some point the coming decade has to be amazingly high.
We cannot run $trillion deficits every year forever. It just won't work. And as soon as the Fed steps off the gas and/or Congress steps off the stimulus we will see this recovery for the hot air it really is.
Yet, in spite of all those generous assumptions, no double dip recession, no second recession, high rates of job growth and falling participation rates all the way through 2020, and unemployment peaking at 11.6% not 13%, the best I can do is suggest the unemployment rate will be over 10% all the way through 2015 and never dip below 8% all the way out through the end of 2020.
"On average, the economists don't expect unemployment to fall below 6% until 2013."
It could take until 2014-15 before we see a 5% handle on unemployment again," said Diane Swonk at Mesirow Financial."
Yeah Right.
Happy Job Hunting
Addendum:
John Mauldin asked me to post the spreadsheet for people to download an try themselves. I think that is a good idea.
Click Here to download the Unemployment Excel Spreadsheet
Usage Notes:
All fields are derived or static except columns E - Monthly Labor Pool Increase and H- Jobs Gained/Lost Per Month
E - Monthly Labor Pool Increase = Your estimate of how many jobs the economy must produce each month to hold the unemployment rate relatively steady. Because of baby boomer demographics, I have this as a falling number.
H- Jobs Gained/Lost Per Month = Your estimate as to how many jobs the economy will gain per month, on average for each year
All other fields like unemployment rate and participation rate will be modified when you change those columns.
Numbers are in Millions
e.g. A monthly labor pool increase of .12 = 120,000 persons
Misc Notes:
Column J is the civilian noninstitutional population (those over 16 not in prisons). I have that rising at a constant 2.5 million per year, closely matching a BLS forecast.
The unemployment rate is the number of unemployed / labor pool = (D/G)*100
There will be a slight drop in the unemployment rate year to year if the jobs gained/lost per month = the monthly labor pool increase. The reason is the number of unemployed remains constant while the labor pool increases slightly.
TOPICS: Business/Economy
KEYWORDS: 2020; economy; mish; unemployment
1
posted on
11/14/2009 8:24:10 AM PST
by
BGHater
To: blam; sickoflibs
'sobering'™
2
posted on
11/14/2009 8:24:50 AM PST
by
BGHater
("real price of every thing ... is the toil and trouble of acquiring it")
To: BGHater
Bookmark for later read when I have time.
Point to remember:
Unemployment is a lagging indicator in an inventory-based recession.
UNEMPLOYMENT IS A LEADING AND PREDICTIVE INDICATOR IN A CREDIT-BASED RECESSION.
We are currently in a credit-based recession, which we have not had since the Great Depression. All other recessions since then have been inventory-based.
It is far more difficult to get out of a credit-based recession. The first action is to let all institutions that are underwater FAIL. Once that happens, the bad credit can be purged from the economy. After that, people can rebuild.
The stimulus and all this other Keynesian crap is not only delaying the inevitable, it is ensuring that the inevitable correction is far more painful. What they are doing is driving us higher up the cliff before they push us off.
From my own studies, I can only conclude that they know what they are doing and that Obammie and his Commies are intentionally destroying the US dollar and the US as an economic super-power.
To: BGHater
The wonders of Free Trade!
You might enjoy this, this, and this.
Note the dates they were written...
Cheers!
4
posted on
11/14/2009 8:36:29 AM PST
by
grey_whiskers
(The opinions are solely those of the author and are subject to change without notice.)
To: BGHater
Good night! We’ll be sneaking across the Mexican boarder for employment!
5
posted on
11/14/2009 8:53:54 AM PST
by
jonrick46
(The Obama Administration is a blueprint for Fabian Socialism.)
To: BGHater
This is a graphic expression of “Galts Gulch” ..with productive gradually disappearing..probably mostly from regulatory suppression and confiscatory taxation.
6
posted on
11/14/2009 9:08:19 AM PST
by
mo
To: BGHater
7
posted on
11/14/2009 11:46:32 AM PST
by
blam
Disclaimer:
Opinions posted on Free Republic are those of the individual
posters and do not necessarily represent the opinion of Free Republic or its
management. All materials posted herein are protected by copyright law and the
exemption for fair use of copyrighted works.
FreeRepublic.com is powered by software copyright 2000-2008 John Robinson


