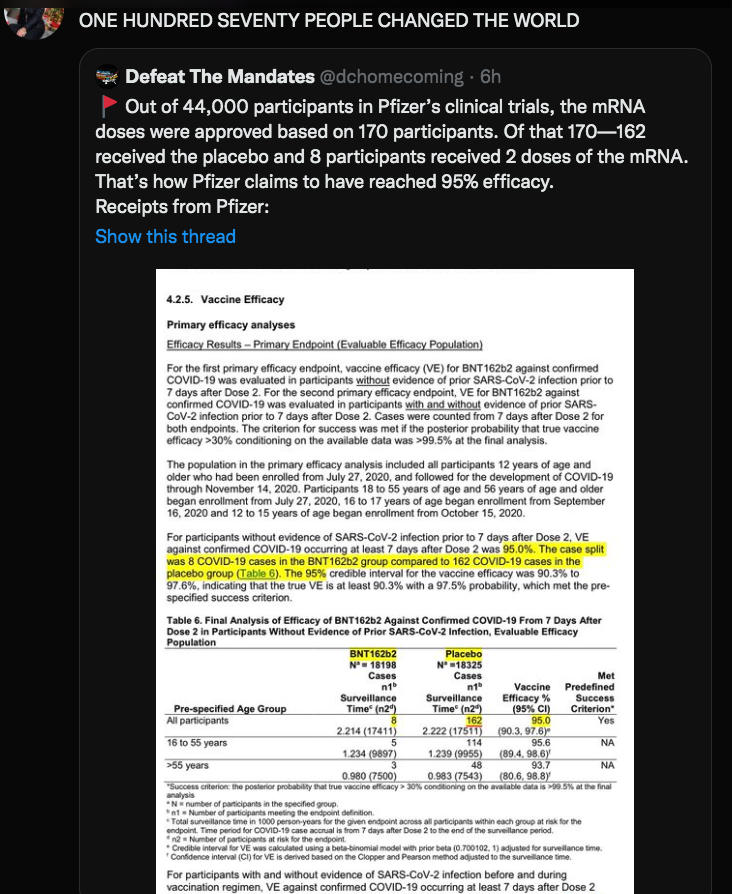
See that footnote that says "N = number of participants in the specified group"?
See where it says "N = 18198" in the vaccinated column and "N = 18325" in the placebo column?
That means there weren't 170 participants, there were 36,523.
Now I recognize that's within the anti-vax margin of error but, come on. Steal a better meme next time.
See this link for an updated table (TABLE 3) shown in your screen grab. https://www.medicines.org.uk/emc/product/13978/smpc.
If I'm reading this table correctly, the top number (N=nnn) is the total population in the study group, the first number in the cell (N1b) is the number of people in the study group who reached the "endpoint definition," and the number in parentheses in the bottom line of the cell (N2d) is the number of people in the study group who are "at risk" for the endpoint.
I'm not sure what the "endpoint definition" is, but I'm assuming it's either death by COVID-19 or confirmed contraction of COVID-19.
If the table is suggesting that only 8 out of 18K people in the vaccine group actually got COVID-19 while 162 out of 18K people got COVID-19 from the placebo group, then it also suggests that about the same amount of people in both groups are still at risk of getting COVID-19 (reaching the endpoint)?
I'm not sure I'm interpreting the chart correctly, but is it saying that even though more people in the placebo group actually got COVID-19 while being studied, that roughly the same number of people in each group are still at risk of getting COVID-19? Or is there a different interpretation of the N22 number?
-PJ