To: impimp
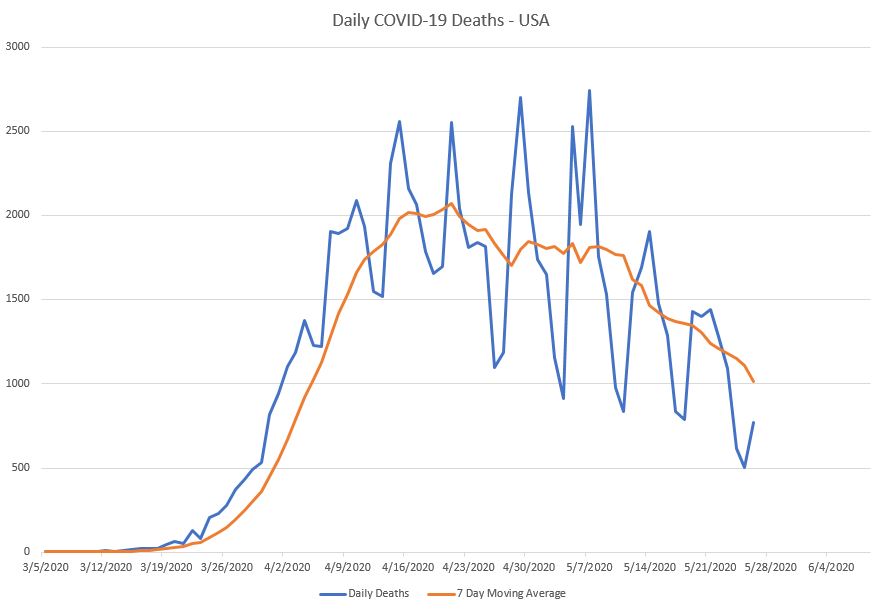
I took the data from Worldometer and imported it into a spreadsheet so I could see trends better. It's readily obvious that the stats people tend to slow down on weekends and make up for what they missed on Monday and (especially) Tuesday. Hence the wild Up/Down swings ever week. So to smooth that out, I did a simple 7 day moving average. That's showing a very nice nearly linear downward trend for the past three weeks. I would expect that because of the holiday the gret numbers over the weekend are a a little less great than reported and we'll see the usual Tuesday peak on Wednesday because of the extended weekend. If that doesn't happen then it's really great news.
62 posted on
05/27/2020 7:13:09 AM PDT by
pepsi_junkie
(Often wrong, but never in doubt!)
To: pepsi_junkie
I ran an analysis on the data from the CDC, looking at the daily death counts. It peaked at 16 Apr 20 (the same time your chart shows). Since then, there has been a statistically significant (p=0.0002) downward trend.
The time to open up the economy was weeks ago.
64 posted on
05/27/2020 7:24:20 AM PDT by
sima_yi
( Reporting live from the far North)
To: pepsi_junkie
Interesting, the chart shows a increase in the decline precisely when people began to ignore the lockdown. It seems sunshine and fresh air truly works to “reduce the curve” better than lockdown.
If lockdown and social distancing worked there should have been a second increase of the disease trend.
Perhaps it really was just the flu, but the lockdown made it worse.
65 posted on
05/27/2020 7:28:15 AM PDT by
American in Israel
(A wise man's heart directs him to the right, but the foolish mans heart directs him toward the left.)
FreeRepublic.com is powered by software copyright 2000-2008 John Robinson