Ok, a question:
Looking at Worldometer’s USA page, we’ve definitely “flattened the curve” but either by daily new cases or daily new deaths, I see NO indication that overall the daily new deaths are going DOWN. Instead, we have a sustained fatality rate of approx. 2k per day. So, we are “holding our own but bleeding” with present social distancing and restrictions in place. Trying to see into the future, yesterday was the highest number of new US cases yet.
So, unless testing is still accelerating* (could well be), we are looking at most likely that death rate continuing at around 2k for at least 2 weeks, maybe longer. Barring some new & effective treatment, I don’t see it coming down, and, this country HAS to open up at least somewhat: I would not be surprised to see the daily fatalities actually go UP a bit.
*IF testing has been accelerating strongly this past week, then that might be “warping” my attempt to extrapolate into the future / my guess that new infections vs. increasing testing is at present basically a wash and will continue to be. (Anybody have a curve of new tests per day?)
“Herd Immunity”, IF it occurs, should begin to help in another month or so, as does a decline in still living “most vulnerables”, but, again, there is reopening to consider. Summer should help too, but could be a wash (safer activities but a lot more of them?)
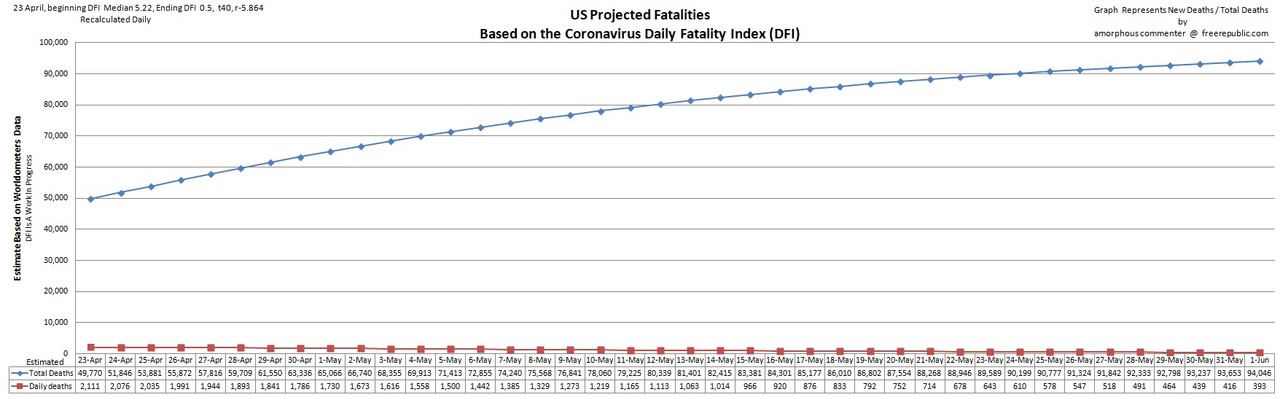
Basically, unless something changes significantly for the better, it looks to me as if we could be easily looking at 100k total fatalities by the end of May. Perhaps more.
Can someone please show a data trend to convince me otherwise? :-(
“Looking at Worldometer’s USA page, we’ve definitely “flattened the curve””
I am not sure if the curve is flatten yet. The New Cases per a day had a high yesterday over 38K. Looks some other States besides New York are starting to climb. Massachusetts and California.
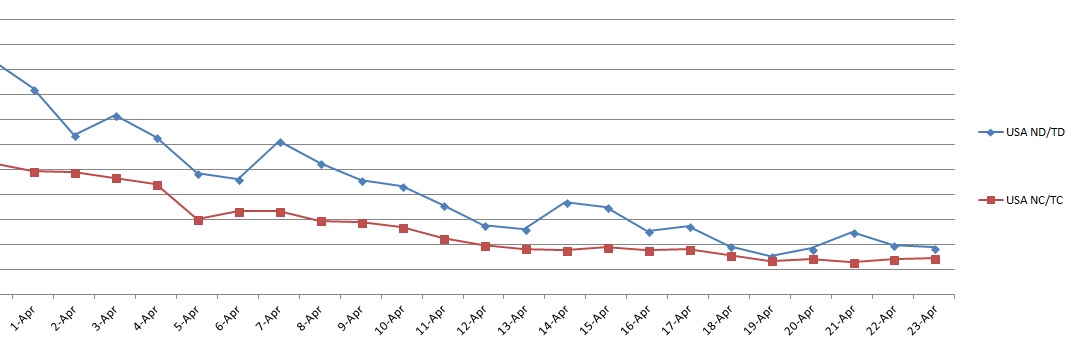
Looking at Worldometer’s USA page, we’ve definitely “flattened the curve” but either by daily new cases or daily new deaths, I see NO indication that overall the daily new deaths are going DOWN. Instead, we have a sustained fatality rate of approx. 2k per day. So, we are “holding our own but bleeding” with present social distancing and restrictions in place. Trying to see into the future, yesterday was the highest number of new US cases yet. Hey Paul, I've been tracking case and fatalities since 18 March. To know the future, watch the case numbers. Except for a cure, or a mutation which affects the lethality of the virus, the number of deaths will follow the number of cases in large part by about 14 days, base on my observation.
In the graph below, see where the red line drops on 17 April, after a number of days at a steady rate. In about 14 days, or the beginning of May, this should translate to a daily drop in the rate of new deaths by about 25%+-.
Basically, unless something changes significantly for the better, it looks to me as if we could be easily looking at 100k total fatalities by the end of May. Perhaps more.
Can someone please show a data trend to convince me otherwise? :-(
My last projection:
New York’s extreme fatality rate of 7.5% has dragged the national CFR higher. Going forward, new cases will likely suffer a more typical CFR of 3% or less. More testing detects more infections, so hopefully these new higher numbers are reflecting more of the mild cases, further pushing down the CFR. At least that’s my hope. From what I’ve seen online, our testing hasn’t increased much since reaching 150K/day a week or two ago. With every state doing their own testing and reporting, it’s hard to say if we are seeing accurate numbers.