Looking at Worldometer’s USA page, we’ve definitely “flattened the curve” but either by daily new cases or daily new deaths, I see NO indication that overall the daily new deaths are going DOWN. Instead, we have a sustained fatality rate of approx. 2k per day. So, we are “holding our own but bleeding” with present social distancing and restrictions in place. Trying to see into the future, yesterday was the highest number of new US cases yet. Hey Paul, I've been tracking case and fatalities since 18 March. To know the future, watch the case numbers. Except for a cure, or a mutation which affects the lethality of the virus, the number of deaths will follow the number of cases in large part by about 14 days, base on my observation.
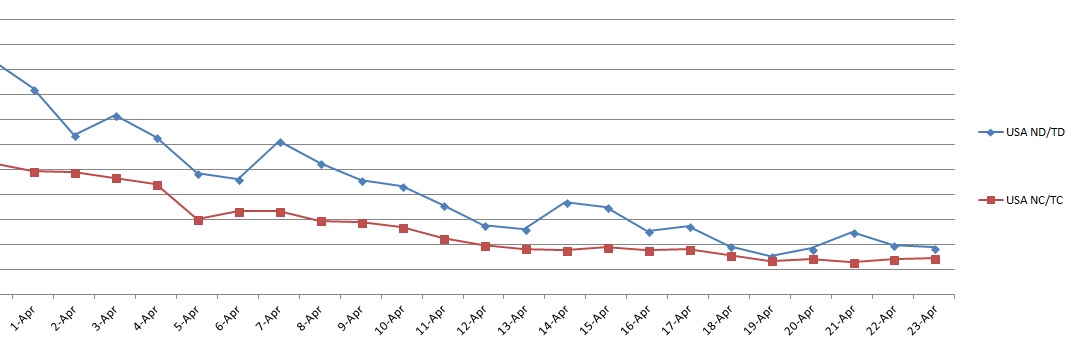
In the graph below, see where the red line drops on 17 April, after a number of days at a steady rate. In about 14 days, or the beginning of May, this should translate to a daily drop in the rate of new deaths by about 25%+-.
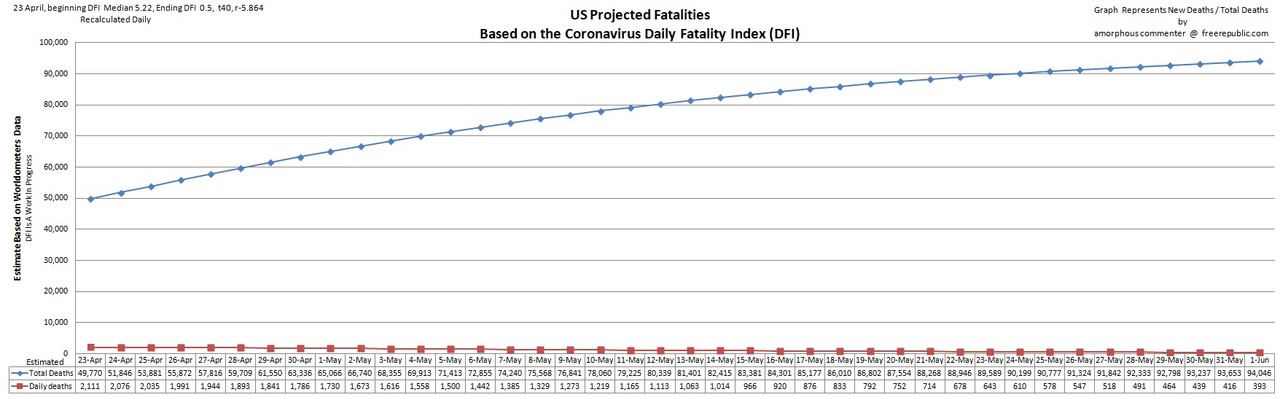
Basically, unless something changes significantly for the better, it looks to me as if we could be easily looking at 100k total fatalities by the end of May. Perhaps more.
Can someone please show a data trend to convince me otherwise? :-(
My last projection:
Generally I agree, including the 14 day lag, however,
To know the future, watch the case numbers.
which for the US have been rising the last few days. I tried guesstimating off that trend (basically assuming daily cases are now "wobbling" around an average of 30k / day) and your existing prediction of almost 93.7k fatalities by 5/31 and again come in at a minimum of 100k fatalities by 4/31.
https://www.worldometers.info/coronavirus/country/us/
The spike for 4/24, 38,958 new cases, got my attention as it sort of put an exclamation point on the 3 day trend. 4/24 is hopefully a data quirk - Fridays have tended to be "hot" days, reporting-wise, but even allowing for that, 4/24 would still be the 3rd consecutive rise of the daily new case number. MAYBE something more has kicked in with testing?
I'm very much crossing my fingers that 4/25 comes in below 30k daily new cases for the US...