~~~~~~~~~~~~~~~~~
Questions I always ask at times like these (in order of importance for measurements & setting placemarks (coordinate accuracy):
Are you sure that...
- you have Preferences/3D View/Elevation Exaggeration set to minimum (0.01)?
- you have Preferences/3D View/High Quality Terrain set to "ON" (checked)?
- you have all TILT zeroed out?
- you are working at maximium zoom?
- you have North set to "top"? (Click on the "N" at upper right...)
~~~~~~~~~~~~~~
BTW, I've been thinking: the XYZ data for that USGS benchmark on your local hill was probably incorporated directly into GE's DEM/DTM/DSM. When you're positioned exactly on it (at max zoom), your GE elevation & coordinates should match the USGs's elevation & coordinates.
You probably can use it to calibrate the accuracy of your positioning. (Off-position = off elevation...) Try putting the coordinates from the BM into GE's "Search" field; that should "drop" you right on the BM point in GE's Digital Model .
Set a "placemark" there & click "Snapshot current view". Then, double-clicking on the placemark name -- at any time -- should return you to that exact point on GE's digital model -- even with the placemark not displayed (un-checked)...
(NOTE: You'll notice that the BM Placemark appears to "move around" on different views. The placemark is "fixed to" GE's Digital Model; the apparent positioning errors are introduced when images from varying satellite viewpoints are "draped over" the DSM -- and don't quit "fit"...)
~~~~~~~~~~~
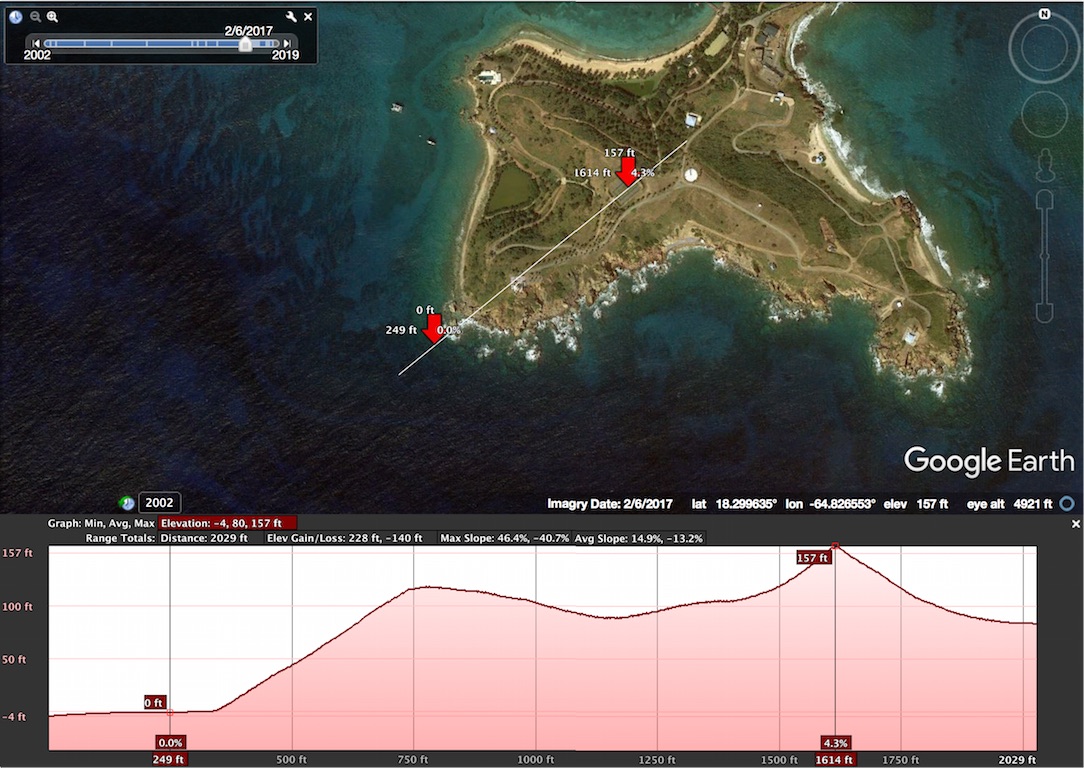
1) Just create a simple 2-point "PATH" -- starting in the water and running thru the profile you want to measure.
2) SAVE it with whatever name you like.
3) Right or CTRL-click on the filename, and = on the pop-up menu, click, "Show Elevation Profile"
Now, you can move your cursor along the plot at bottom -- and... Voilá!! '-)
~~~~~~~~~~~~~~
Notice that I was interested in the Tennis Court. Putting my cursor on the highest point on the profile puts it smack dab in the middle of the tennis court! Since this is a plot of the DEM/DTM/DSM, it definitely validates my "Warped Tennis Court" theory! (GE still thinks the middle of the TC is a sharp peak!)
Hope this was helpful!
TXnMA

P.S. EMI-Guy: hope you didn't mind my sharing this with others...
P.P.S. Other addressees: Hope this "NUts'N'Bolts" stuff didn't bore you! At least, it should give you confidence that we're not just guessing about this OHI analysis stuff! Besides -- some of you might want to help -- and here are some [unclassified] "tools of the trade"...'-)
WWG1WGA