Posted on 02/19/2015 4:54:08 AM PST by Colofornian
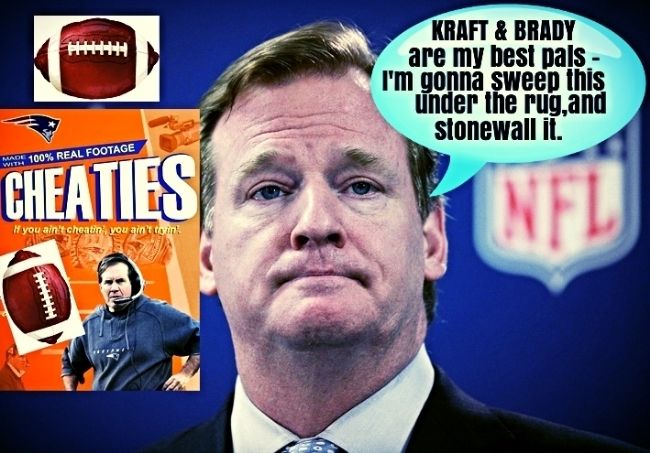
The unapproved kicking ball that sources told "Outside the Lines" that a Gillette Stadium officials' locker room attendant tried to introduce into the AFC Championship Game was handed to the man by an NFL employee, a source told ESPN's Adam Schefter on Wednesday.
(Excerpt) Read more at espn.go.com ...
...not to mention Welker, and later Welker plus Branch.
Knowingly giving a deflated ball as your game ball is cheating.
Taking advantage of a weak inspection system doesn’t make it any less cheating.
Ok so two wrongs make a right in your book.
I’m saying you should look at some context. ...and maybe the actual rule. ...and maybe also understand that the PSI range wasn’t set as a rule by some evaluations of pressure meets standards of sportsmanship, but rather as the expected treatment/best results by the manufacturer some time before 1940 ( no one seems to know how much before, nor has it ever been changed despite balls being out of spec for pretty much every cold or hot weather game since players had heated equipment rooms).
And then there’s the whole weight of the balls thing. Is it really sane to claim teams are cheating when the balls get wet during play? Did both teams cheat? If so, did those two wrongs make a right? ...because that makes far more difference in how the balls act than the presssure differences being discussed.
Or is this merely hyperventilating over the nature of navel lint?
wow the stretches some people will go just to justify their preferred team cheating.
I’m a Browns fan...and guess what they cheated with text messages. See it’s easy to admit when your team screws up...it’s the lies and coverups and excuses that makes me sick. And why people can’t stand the patriots.
He’s already been shown the fumble statistics in the article are a mixture of cherry picking and junk. (Lepton, post #40)
Are these fumble stats "bad math?" "Cherry picking?" Junk stat science? If it's been debunked, by whom? When? Where? Did they use the same variable comparison suggested by two FREEPERs on this thread -- Edzo4 & WinMod70?
Take a look @ what they said:
I wonder if bradys improvement in 2007 had anything to do with having randy moss as a receiver? Instead of the non hall of fame receivers he had before. (Edzo4, post #28)
There are many variables in the game of football, the most significant are talent and preparation. You portend that the only change in the history of Patriots football is the ball. Really? (WinMod70, post #19)
In the above posts, both Edzo4 & WinMod70 suggested that the hyper completion stats Brady had in 07 vs. 06 was due to wide receiver personnel (Edzo mentions Randy Moss, who played full season wise 07 to 09 for Pats); & WinMod mentions how "talent" is a key consideration.
Indeed, personnel is a vitally important variable -- one that can't be understated.
I wanted to see if a personnel study of the Patriot backfield would indeed "debunk" the whole thing. Instead of generic stats flying around, let's just boil this down to specific players and crunch the numbers! (Let's not only apply personnel justifications to Brady's sudden completion % explosion in 2007 -- but to the fumble-free per touch ratio as well.)
There's two ways to do that:
1. You review how Patriot RB did up thru 2006 and then compare it to 2007 & beyond when the NFL changed the footballs supplies' rules.
2. You review how Patriot RB did anytime between 2007 -- 2014 -- as long as you have some Patriot years from that same period.
In both cases above, the player's performance is being measured against himself -- how he did either in a Patriot vs. non-Patriot uniform (#2), or, how he did in the same Patriot uniform on either side of that 2006-2007 divide.
Also, this study then aggregated ALL of those RB stats. In case, somebody might claim that the results could be skewed by including fumble figures from the first two seasons of a player's career, a time when they might be more inclined to fumble, within the second chart below, I segmented those out. (It wound up dropping a couple of "primary" comparison backs into the "marginal" area -- and wound up dropping Danny Woodhead altogether out of the "marginal" category.
Upon reviewing Patriot rosters...which RB qualified for such a case study?
RB who didn't make the "cut" due to not making either of the above criteria:
a. Bolden, Vereen & Ridley didn't play before 07 & haven't played for other teams...certainly, somebody can add them to the future eval list if they sign with other teams.
b. Corey Ridley retired after 06 season.
Who made this case study cut?
Nine Patriot RBs fit the initial criteria; yet I had to place 4 of them in the "marginal" category as having a questionable enough carries for "measurable weight" purposes...their stats might be helpful in reviewing on a "collective" basis, but not so much on a personal comparison.
1. Heath Evans (only 45 carries for NE; yes, no fumbles, in 07-08) vs. 3 fumbles in 119 carries elsewhere
2. Fred Taylor (106 carries, only 1 fumble for 09-10 NE; and yes a better non-fumble ratio than elsewhere ... 26 fumbles in 2428 attempts ... but not significant difference and hard to compare vs. only 106 carries)
3. Lamont Jordan (80 carries, only 1 fumble for 08 NE; not only not enough carries, but this is a slight flip of Taylor the other way in that he didn't fumble much elsewhere -- 8 fumbles, 817 carries...but again not enough significant difference)
4. Danny Woodhead (more of a RB receiver; only 24 carries for '13 chargers...only 35 carries for NE)
That left 5 RBs who have a significant number of carries (over 200 on each side) to serve as the best players to measure:
1. Laurence Maroney (add 07-09 NE, 407 carries vs. 06 NE, '10 Denver, 211 carries)
2. BenJarvus Green-Ellis (08-11 NE, 510 carries vs. 12-13 Cincy, 498 carries)
3. LeGarrette Blount (13-14 NE, 213 carries vs. 10-12 TB & 14 Pit -- played for 2 teams in 14, 491 carries)
4. Kevin Faulk (99-06 NE, 632 carries vs. 07-11 NE, 232 carries)
5. Sammy Morris (07-10 NE, 334 carries vs. 00-06 Buff & Miami + '11 Dallas, 402 carries overall)
So how did this "Case Study" turn out?
(See next post!)
He’s already been shown the fumble statistics in the article are a mixture of cherry picking and junk. (Lepton, post #40)
Are these fumble stats "bad math?" "Cherry picking?" Junk stat science?
| NAME | Years w/Pats | Carries w/Pats | Fumbles as a Pat | Years either w/other team, or w/Pats before '07 | Non-Pat or Early-Pat Carries | Non-Pat or Early-Pat Fumbles | Fumbles Per Touch Comparison -- first # represents time with NE 2007 or after |
| Laurence Maroney | 2007-2009 | 407 | 4 | 2006 Pats + 2010 Broncos | 211 | 2 | 1F per 102 vs. 1F per 106 |
| BenJarvus Green-Ellis | 2008-2011 | 510 | 0 | 2012-2013 Bengals | 498 | 5 | Less than 1F per 510 touches vs. 1F per 100 |
| LeGarrette Blount | 2013-2014 | 213 | 3 | 2010-2012 Bucs + 2014 Steelers (was w/2 teams in 2014) | 426 | 9 | 1F per 71 vs. 1F per 47 |
| Kevin Faulk | 2007-2011 | 232 | 2 | 1999-2006 Pats | 632 | 23 | 1F per 116 vs. 1F per 28 |
| Sammy Morris | 2007-2010 | 334 | 4 | 2000-2006 Bills & Dolphins | 402 | 8 | 1F per 84 vs. 1F per 50 |
| 5-Back Sub-Total | 1696 | 13 | 2169 | 47 | 1F in 130 vs. 1F in 46 | ||
| Fred Taylor | 2009-2010 | 106 | 1 | 1998-2008 Jags | 2428 | 26 | 1F in 106 vs. 1F in 93 |
| LaMont Jordan | 2008 | 80 | 1 | 2001-2007, 2009 Jets, Raiders & Broncos | 817 | 8 | 1F per 80 vs. 1F per 102 |
| Heath Evans | 2007-2008 | 45 | 0 | 2001-2005 'Hawks, Dolphins, 2006 Pats & 2009-2010 Saints | 119 | 3 | Less than 1F per 45 vs. 1F per 40 |
| Danny Woodhead | 2011-2012 | 35 | 2 | 2013 Chargers | 24 | 0 | 1F per 18 vs. 1F less than 24 |
| 4-Marginal Backs' Sub-Total | --- | 266 | 4 | --- | 3388 | 37 | 1F in 67 vs. 1F in 92 |
| Total (All 9 backs) | --- | 1962 | 17 | --- | 5557 | 84 | 1F in 115 vs. 1F in 66 |
| NAME | Years w/Pats | Carries w/Pats | Fumbles as a Pat | Years either w/other team, or w/Pats before '07 | Non-Pat or Early-Pat Carries | Non-Pat or Early-Pat Fumbles | Fumbles Per Touch Comparison |
| BenJarvus Green-Ellis | 2010-2011 | 410 | 0 | 2012-2013 Bengals | 498 | 5 | Less than 1F per 410 touches vs. 1F per 100 |
| Kevin Faulk | 2007-2011 | 232 | 2 | 2001-2006 Pats | 401 | 14 | 1F per 116 vs. 1F per 29 |
| Sammy Morris | 2007-2010 | 334 | 4 | 2002-2006 Bills & Dolphins | 146 | 2 | 1F per 84 vs. 1F per 73 |
| 3-Back Sub-Total | --- | 976 | 6 | --- | 1051 | 21 | 1F in 163 vs. 1 in 50 |
| Fred Taylor | 2009-2010 | 106 | 1 | 2000-2008 Jags | 2405 | 23 | 1F per 106 vs. 1F per 104 |
| LaMont Jordan | 2008 | 80 | 1 | 2003-2007 Jets, Raiders, 2009 Broncos | 694 | 4 | 1F per 80 vs. 1F per 174 |
| Heath Evans | 2007-2008 | 45 | 0 | 2004-2006 'Hawks, Dolphins & Pats + 2009-2010 Saints | 93 | 2 | 1F less than 45 vs. 1F per 47 |
| LeGarrette Blount | 2013-2014 | 213 | 3 | 2012 Bucs + 2014 Steelers (was w/2 teams in 2014) | 106 | 1 | 1F per 71 vs. 1F per 106 |
| Laurence Maroney | 2008-2009 | 222 | 4 | 2010 Broncos | 36 | 1 | 1F in 56 vs. 1F in 36 |
| 5-Marginal Backs' Sub-Total | --- | 666 | 9 | --- | 3334 | 31 | 1F per 74 vs. 1F per 108 |
| Total (All 8 backs) | --- | 1642 | 15 | Mostly non-Patriot stats by either ex-Pats or future Pats | 4385 | 52 | 1F in 109 vs. 1F in 84 |
Raw stat source: www.pro-football-reference.com (Chart by Colofornian)
The "case study" revealed that some dramatic stat reversals occurred with several players, especially Sammy Morris and Kevin Faulk.
Morris was the top ball-carrier in 2008, and the #2 carrier in 2007 and 2009. Kevin Faulk was the #2 runner in 2008, and #3 in 2007. Blount, too, the #2 back in 2013, also had significantly better non-fumble ratios (a fumble every 47 touches playing elsewhere vs. 71 touches playing with the Pats)
If you recall the fumble figures that jumped off the pages...
...see Dumb Luck: The New England Patriots’ prevention of fumbles is nearly impossible.
...once the rules were changed allowing teams to supply their own balls for offense, the Pats went from averaging a fumble every 42 touches to one every 73 or 74! (And they were doing this sudden transformation, year in, year out at the happenstance year of 2007).
Sammy Morris is a "poster boy" for fleshing this out: With the Bills & Dolphins pre 2007, a fumble every 50 touches. With the Patriots, up to a fumble every 84 touches.
Kevin Faulk seemed to especially become a sudden beneficiary of something magical: He had been playing with the Pats since 1999...for the years 1999 to 2006, Faulk averaged a fumble every 28 touches. Suddenly, from 2007 through 2011, Faulk only fumbled it twice more (once every 116 touches).
Overall, when you concentrate on the 9 backs' totals...the Patriots averaged only 1 fumble every 115 touches -- vs. 1 every 66 touches when these SAME RB were either playing in another uniform or using NFL-supplied balls.
It's not also a situation where a RB simply "improved" as he moved deeper into his career. BenJarvus Green-Ellis is a prime example: Green-Ellis didn't fumble...as in at all in 510 Patriot carries 2007-2011. I mean, that's astounding!
But then Green-Ellis moved over to the Bengals for a few years where he carried the ball about the same # of overall times...and fumbled it 5 times (less than 500 carries).
The Patriots...given their first op to supply their own footballs in 2007...had five RB who carted the ball 399 times. Do you know how often they fumbled?
Even segmenting the first two years out of a RB's career, the figures still showed significant distinctives: 1 fumble every 109 touches for the Pats' RBs...vs. 1 fumble for every 84 touches when they were wearing another uniform or running with NFL-supplied balls.
The one RB that it didn't seem to statistically matter was Laurence Maroney, the Pats' top back in 2007 and 2009. (For him, the case study looked at 2007-2009 vs. his 2006 Pat season and a limited Bronco season in 2010).
Wow, I’m almost speechless. Are you getting paid to go in to this kind of depth? If not, I strongly recommend going out and buying a fishing rod or golf clubs.
Wow, big chunk of spam there.
Meanwhile:
http://regressing.deadspin.com/why-those-statistics-about-the-patriots-fumbles-are-mos-1681805710
It’s bunk.
Go run the numbers again idiot I was referring to your mention of Brady’s completion percentages improving in 07 cause of randy moss
So sorry patriots haters Adam had the story wrong....
McNally was just a fall guy for this NFL-employed scam artist, according to Adam Schefter, ESPN’s well-connected NFL insider. After ESPN put McNally in the crosshairs Tuesday night with a story saying McNally attempted to “introduce” an unapproved football into the game, Schefter winged in Wednesday afternoon with a source saying McNally was, in essence, the fall guy for an NFL employee’s scam to bilk money by stealing footballs. Which were designated for . . . charity.
http://www.csnne.com/blog/patriots-talk/curran-another-black-eye-nfl-deflategate-quest
Just skimming...your evaluations are highly dependent on a few picked RBs. ...but at least you eliminated the original articles’ conflation of Brandon Tate Patriots WR fumbles with those as a Bengals kickoff returner (roughly half the total result, as I recall).
BenJarvis Green Ellis didn’t fumble once in college either. Why did he start fumbling with the Bengals? Maybe because they don’t place such an emphasis? (my Bungals are legendary). Cincinnati placed 16th on average for those years.
Tampa Bay placed 19th (zero Blount fumbles in 2012, and 1 with Steelers). In 2011, Blount had but 3 of his teams 30 fumbles. With 30 fumbles, he was the least of their fumbling troubles...and that was his career high, which he also reproduced in 2013 with the Pats. Atlanta, for example totalled 34 fumbles during that 3 year span.
Sammy Morris’ fumbling is almost entirely based on the effects of one year - 4 of Morris 12 career fumbles were in 2006, with the other 8 evenly divided between the Pats and the other non-pats seasons.
Kevin Faulk only fumbled 4 times as a RB after his first two years...three of which were in 2003.
The rest of the RBs are about the same or improved after they leave the Pats.
On the other hand, the patriots will bench even their lead rusher for fumbling since they’ve had the example of BJGE to show that fumbles can be avoided. After one ‘freebee’, Ridley got benched sometimes for multiple games every time he fumbled....or almost fumbled.
The Patriots have only been tops in fumbles twice from 2007-2014. Atlanta has a similar run of low fumbles being in the top 5 all but two years beginning in 2006 - but placing 11th instead of 4th in 2008, and 9th instead of the Patriots 24th in 2013. Indianapolis, from 2004 to 2010 does likewise. Those are the only two I tracked...but it’s not like the Patriots are first every single year.
On the other hand, New England went to a short passing game with picking up Welker in 2007, and continuing with Edelman and Amendola - where Tom Brady would rather throw an incompletion or low pass than lead his receiver into a big hit, which each keeps his receivers healthier and makes them less likely to fumble.
These are verbal demonstrations of how thin your analysis is. Follow the links I posted to you earlier for several different analyses of the mangling of statistics that Sharps employed.
I’m done. Have fun.
Warren Sharp took a broader approach with individual players -- including "touches" (receptions & runs):
New England Patriots Fumble More Often When Playing for Other Teams
His analytics zero in on 19 players who had both NE time & non-NE time...five of which had 300+ touches for the Pats (Welker, Maroney, Green-Ellis, Morris and Woodhead)
Of course, people have rightly id'd one potential considerable flaw in his #s: Those fumble #s reflect special teams' fumbles, which don't belong since teams don't use team-supplied footballs.
(I say potential because I think it looks like it could be a "wash"...for example, yeah, Brandon Tate's special teams fumbles for the Bengals shouldn't be included in his figures; yet guys like Wes Welker's fumble #s also goes down, etc.)
So in looking @ Sharp's charts at the above link, I figured I needed to know which of those 19 players (+ Faulk -- he doesn't include any pre-NE 2007 stats for comparison analysis like I did) -- were involved in special teams returns...and then how many of those fumbles were wrongly included in his analysis.
And, frankly, I was a little surprised to see backs like Faulk having been a special teams returner early in his career -- so even my analysis needs a very slight corrective. Faulk had 3 fumbles as a special teams returner -- but one of them occurred after 2007 so probably won't alter the ratios all that much.
I was surprised to see that many of his fumbles came on pass catches.
Well, anyway, all that info is available online (for people who know how to find it)...so this weekend...took some time to capture it all into one doc:
Mainly, pinpointed which of those 20 players had special teams returns -- and if they committed fumbles on specific seasons -- were they special teams' related (how many?)?
Secondly, Sharp didn't include playoff stats...which, given that the whole thing blew up during playoffs, I think is relevant & broadens the "touches" for measurement comparisons. So I began adding those #s in as well.
All that's left to do now is to crunch the #s and then run the new fumble-ratio #s as an improvement on Sharp's take.
If I get time later to do that tonight, may have that up first thing in #.
(I'm actually surprised nobody else that I could find ran a "corrective" on Sharp's #s to give us the best comparison...but, again, I think -- after tabulated the special teams' based fumbles...it'll probably be a wash or close to it)
Bottom line I've found -- is you do need about all 20 players -- their collective stats totaled -- to see if a huge distinction was looming as a shadow from the past.
Later in the week, it'd also be interesting to do a breakout:
What's the ratio comparison of WR, TE, RB fumbling after a catch vs. a RB rush fumble...and to see if all those #s are also similar. (There were a few backs I didn't want to take the time to delve into their steep history -- like Fred Taylor, for example -- so I don't have all the raw data on all 20 of those players).
Tate has so few Non NE "touches" (only 35) -- that for him to have 11 fumbles with only 35 touches weighs down that side heavily.
In checking ALL 11 of those fumbles were either as a kick or punt returner.
The rest are probably "a wash"...but Sharp blew it to include him without realizing what that was doing to his analytics.
Disclaimer: Opinions posted on Free Republic are those of the individual posters and do not necessarily represent the opinion of Free Republic or its management. All materials posted herein are protected by copyright law and the exemption for fair use of copyrighted works.