Skip to comments.
Nebraska Presidential elections - Obama 2008 compared to Biden 2020
Nebraska 2008 election by county and Nebraska 2020 election by county ^
| December 8, 2021
| my own calculations
Posted on 12/08/2021 2:51:36 PM PST by kiryandil
This is a comparison of the Nebraska presidential elections of 2008 (Obama) and 2020 (Biden).
Some interesting things can be seen in the vote totals.
TOPICS: Politics
KEYWORDS: 2020votefraud; audit; electionfraud; ne; nebraska; stolenelection; votefraud; votefraudmothership
Navigation: use the links below to view more comments.
first 1-20, 21-29 next last
| Democrat county victory |
|
|
|
|
|
|
|
|
|
|
|
|
|
|
|
|
|
| more than 100% of the 2008 Obama vote |
|
|
|
|
|
|
|
|
|
|
|
|
|
|
|
|
|
|
|
|
|
|
|
|
|
|
|
|
|
|
| Biden | Biden |
|
|
|
|
|
|
| 2008 |
|
|
|
|
|
| 2020 |
| minus | div |
|
|
|
| 2008 Obama |
| McCain | Total |
|
|
| 2020 Biden |
| Trump | Total |
| Obama | Obama |
|
|
| Adams | 35% | 4,685 | 62% | 8,252 | 13,210 |
| Adams | 29% | 4,213 | 69% | 10,085 | 14,653 |
| -472 | 90% |
|
|
| Antelope | 24% | 757 | 75% | 2,383 | 3,185 |
| Antelope | 13% | 452 | 86% | 3,093 | 3,587 |
| -305 | 60% |
|
|
| Arthur | 15% | 39 | 83% | 217 | 263 |
| Arthur | 7% | 21 | 91% | 260 | 285 |
| -18 | 54% |
|
|
| Banner | 15% | 62 | 84% | 348 | 416 |
| Banner | 10% | 43 | 88% | 362 | 411 |
| -19 | 69% |
|
|
| Blaine | 14% | 43 | 84% | 266 | 316 |
| Blaine | 11% | 35 | 88% | 280 | 317 |
| -8 | 81% |
|
|
| Boone | 26% | 742 | 72% | 2,042 | 2,836 |
| Boone | 15% | 499 | 82% | 2,653 | 3,226 |
| -243 | 67% |
|
|
| Box Butte | 39% | 1,886 | 60% | 2,932 | 4,857 |
| Box Butte | 20% | 1,051 | 77% | 4,002 | 5,200 |
| -835 | 56% |
|
|
| Boyd | 23% | 250 | 76% | 839 | 1,110 |
| Boyd | 12% | 135 | 87% | 1,010 | 1,155 |
| -115 | 54% |
|
|
| Brown | 20% | 311 | 77% | 1,208 | 1,567 |
| Brown | 11% | 191 | 87% | 1,470 | 1,684 |
| -120 | 61% |
|
|
| Buffalo | 30% | 5,867 | 68% | 13,097 | 19,293 |
| Buffalo | 27% | 6,350 | 70% | 16,640 | 23,711 |
| 483 | 108% |
|
|
| Burt | 42% | 1,413 | 56% | 1,907 | 3,387 |
| Burt | 28% | 1,063 | 69% | 2,580 | 3,739 |
| -350 | 75% | 1st CD |
|
| Butler | 31% | 1,190 | 67% | 2,557 | 3,839 |
| Butler | 19% | 873 | 78% | 3,542 | 4,518 |
| -317 | 73% | 1st CD |
|
| Cass | 39% | 4,753 | 59% | 7,120 | 12,122 |
| Cass | 31% | 4,737 | 66% | 10,121 | 15,326 |
| -16 | 100% | 1st CD |
|
| Cedar | 29% | 1,190 | 70% | 2,912 | 4,174 |
| Cedar | 14% | 725 | 83% | 4,174 | 5,015 |
| -465 | 61% |
|
|
| Chase | 18% | 341 | 80% | 1,477 | 1,844 |
| Chase | 11% | 226 | 87% | 1,740 | 2,000 |
| -115 | 66% |
|
|
| Cherry | 20% | 599 | 77% | 2,360 | 3,059 |
| Cherry | 11% | 373 | 87% | 2,844 | 3,269 |
| -226 | 62% |
|
|
| Cheyenne | 24% | 1,173 | 74% | 3,572 | 4,839 |
| Cheyenne | 18% | 855 | 80% | 3,813 | 4,776 |
| -318 | 73% |
|
|
| Clay | 26% | 780 | 72% | 2,177 | 3,033 |
| Clay | 18% | 632 | 80% | 2,848 | 3,570 |
| -148 | 81% |
|
|
| Colfax | 35% | 1,125 | 63% | 2,018 | 3,203 |
| Colfax | 28% | 1,025 | 71% | 2,636 | 3,726 |
| -100 | 91% | 1st CD |
|
| Cuming | 31% | 1,274 | 67% | 2,732 | 4,087 |
| Cuming | 20% | 870 | 79% | 3,507 | 4,459 |
| -404 | 68% | 1st CD |
|
| Custer | 21% | 1,192 | 77% | 4,301 | 5,578 |
| Custer | 13% | 786 | 85% | 5,090 | 6,010 |
| -406 | 66% |
|
|
| Dakota | 47% | 2,994 | 51% | 3,292 | 6,396 |
| Dakota | 40% | 2,744 | 58% | 3,926 | 6,817 |
| -250 | 92% |
|
|
| Dawes | 34% | 1,285 | 63% | 2,376 | 3,775 |
| Dawes | 26% | 1,082 | 71% | 2,931 | 4,151 |
| -203 | 84% |
|
|
| Dawson | 30% | 2,399 | 68% | 5,460 | 7,986 |
| Dawson | 27% | 2,497 | 71% | 6,524 | 9,191 |
| 98 | 104% |
|
|
| Deuel | 24% | 243 | 74% | 732 | 993 |
| Deuel | 14% | 141 | 84% | 871 | 1,034 |
| -102 | 58% |
|
|
| Dixon | 34% | 946 | 64% | 1,785 | 2,794 |
| Dixon | 21% | 651 | 75% | 2,335 | 3,094 |
| -295 | 69% |
|
|
| Dodge | 43% | 6,689 | 55% | 8,557 | 15,550 |
| Dodge | 33% | 5,544 | 65% | 10,984 | 16,938 |
| -1,145 | 83% | 1st CD |
|
| Douglas | 52% | 116,810 | 47% | 106,291 | 226,701 |
| Douglas | 54% | 150,350 | 43% | 119,159 | 276,540 |
| 33,540 | 129% | 2nd CD |
|
| Dundy | 21% | 218 | 77% | 783 | 1,019 |
| Dundy | 10% | 105 | 88% | 883 | 1,003 |
| -113 | 48% |
|
|
| Fillmore | 33% | 962 | 65% | 1,913 | 2,947 |
| Fillmore | 22% | 693 | 75% | 2,359 | 3,148 |
| -269 | 72% |
|
|
| Franklin | 28% | 442 | 70% | 1,079 | 1,552 |
| Franklin | 16% | 276 | 83% | 1,437 | 1,728 |
| -166 | 62% |
|
|
| Frontier | 25% | 349 | 74% | 1,034 | 1,404 |
| Frontier | 13% | 189 | 85% | 1,229 | 1,446 |
| -160 | 54% |
|
|
| Furnas | 24% | 556 | 74% | 1,725 | 2,328 |
| Furnas | 15% | 399 | 83% | 2,163 | 2,602 |
| -157 | 72% |
|
|
| Gage | 44% | 4,473 | 53% | 5,435 | 10,160 |
| Gage | 30% | 3,385 | 67% | 7,445 | 11,119 |
| -1,088 | 76% |
|
|
| Garden | 25% | 283 | 74% | 844 | 1,138 |
| Garden | 13% | 161 | 85% | 1,016 | 1,200 |
| -122 | 57% |
|
|
| Garfield | 21% | 212 | 78% | 800 | 1,030 |
| Garfield | 12% | 133 | 87% | 933 | 1,076 |
| -79 | 63% |
|
|
| Gosper | 25% | 260 | 74% | 776 | 1,048 |
| Gosper | 19% | 215 | 80% | 893 | 1,121 |
| -45 | 83% |
|
|
| Grant | 11% | 41 | 87% | 318 | 367 |
| Grant | 5% | 20 | 93% | 375 | 402 |
| -21 | 49% |
|
|
| Greeley | 38% | 458 | 60% | 715 | 1,199 |
| Greeley | 18% | 229 | 81% | 1,016 | 1,259 |
| -229 | 50% |
|
|
| Hall | 37% | 7,855 | 61% | 12,977 | 21,271 |
| Hall | 31% | 7,681 | 66% | 16,189 | 24,450 |
| -174 | 98% |
|
|
| Hamilton | 28% | 1,332 | 71% | 3,389 | 4,799 |
| Hamilton | 20% | 1,118 | 77% | 4,309 | 5,566 |
| -214 | 84% |
|
|
| Harlan | 23% | 402 | 75% | 1,329 | 1,766 |
| Harlan | 15% | 282 | 84% | 1,615 | 1,934 |
| -120 | 70% |
|
|
| Hayes | 15% | 85 | 83% | 461 | 553 |
| Hayes | 6% | 34 | 92% | 494 | 536 |
| -51 | 40% |
|
|
| Hitchcock | 25% | 346 | 73% | 1,001 | 1,379 |
| Hitchcock | 12% | 175 | 86% | 1,264 | 1,470 |
| -171 | 51% |
|
|
| Holt | 22% | 1,089 | 75% | 3,746 | 4,974 |
| Holt | 12% | 686 | 86% | 4,769 | 5,550 |
| -403 | 63% |
|
|
| Hooker | 17% | 75 | 81% | 355 | 438 |
| Hooker | 13% | 59 | 85% | 376 | 442 |
| -16 | 79% |
|
|
| Howard | 36% | 1,083 | 62% | 1,847 | 2,996 |
| Howard | 18% | 648 | 79% | 2,786 | 3,511 |
| -435 | 60% |
|
|
| Jefferson | 41% | 1,520 | 57% | 2,103 | 3,697 |
| Jefferson | 27% | 1,016 | 70% | 2,616 | 3,730 |
| -504 | 67% |
|
|
| Johnson | 43% | 914 | 54% | 1,142 | 2,110 |
| Johnson | 29% | 647 | 68% | 1,518 | 2,233 |
| -267 | 71% |
|
|
| Kearney | 28% | 876 | 71% | 2,224 | 3,150 |
| Kearney | 19% | 701 | 78% | 2,822 | 3,617 |
| -175 | 80% |
|
|
| Keith | 25% | 974 | 74% | 2,942 | 3,968 |
| Keith | 17% | 763 | 81% | 3,544 | 4,369 |
| -211 | 78% |
|
|
| Keya Paha | 22% | 115 | 77% | 409 | 533 |
| Keya Paha | 9% | 49 | 90% | 476 | 530 |
| -66 | 43% |
|
|
| Kimball | 24% | 439 | 74% | 1,346 | 1,811 |
| Kimball | 14% | 268 | 83% | 1,563 | 1,877 |
| -171 | 61% |
|
|
| Knox | 31% | 1,255 | 67% | 2,728 | 4,084 |
| Knox | 19% | 905 | 79% | 3,721 | 4,708 |
| -350 | 72% |
|
|
| Lancaster | 52% | 65,734 | 47% | 59,398 | 127,490 |
| Lancaster | 52% | 82,293 | 45% | 70,092 | 157,215 |
| 16,559 | 125% | 1st CD |
|
| Lincoln | 31% | 5,046 | 66% | 10,817 | 16,277 |
| Lincoln | 22% | 3,692 | 76% | 13,071 | 17,163 |
| -1,354 | 73% |
|
|
| Logan | 19% | 81 | 79% | 327 | 416 |
| Logan | 8% | 38 | 90% | 407 | 450 |
| -43 | 47% |
|
|
| Loup | 22% | 86 | 77% | 302 | 393 |
| Loup | 17% | 75 | 82% | 370 | 454 |
| -11 | 87% |
|
|
| Madison | 30% | 4,142 | 69% | 9,655 | 14,007 |
| Madison | 22% | 3,478 | 75% | 11,940 | 15,819 |
| -664 | 84% | 1st CD |
|
| McPherson | 15% | 45 | 82% | 240 | 293 |
| McPherson | 6% | 17 | 91% | 275 | 302 |
| -28 | 38% |
|
|
| Merrick | 29% | 986 | 69% | 2,375 | 3,431 |
| Merrick | 17% | 743 | 80% | 3,419 | 4,282 |
| -243 | 75% |
|
|
| Morrill | 24% | 557 | 73% | 1,725 | 2,351 |
| Morrill | 15% | 386 | 83% | 2,113 | 2,558 |
| -171 | 69% |
|
|
| Nance | 32% | 549 | 65% | 1,116 | 1,707 |
| Nance | 20% | 359 | 78% | 1,437 | 1,832 |
| -190 | 65% |
|
|
| Nemaha | 36% | 1,240 | 61% | 2,134 | 3,474 |
| Nemaha | 27% | 921 | 71% | 2,428 | 3,432 |
| -319 | 74% |
|
|
| Nuckolls | 30% | 657 | 67% | 1,498 | 2,221 |
| Nuckolls | 18% | 409 | 81% | 1,857 | 2,305 |
| -248 | 62% |
|
|
| Otoe | 41% | 2,915 | 57% | 4,033 | 7,092 |
| Otoe | 30% | 2,490 | 68% | 5,649 | 8,355 |
| -425 | 85% | 1st CD |
|
| Pawnee | 35% | 483 | 62% | 859 | 1,384 |
| Pawnee | 23% | 322 | 75% | 1,071 | 1,429 |
| -161 | 67% |
|
|
| Perkins | 22% | 310 | 77% | 1,092 | 1,420 |
| Perkins | 13% | 199 | 86% | 1,321 | 1,545 |
| -111 | 64% |
|
|
| Phelps | 23% | 1,050 | 75% | 3,360 | 4,473 |
| Phelps | 15% | 752 | 83% | 4,157 | 5,021 |
| -298 | 72% |
|
|
| Pierce | 24% | 783 | 74% | 2,385 | 3,226 |
| Pierce | 12% | 480 | 86% | 3,462 | 4,012 |
| -303 | 61% |
|
|
| Platte | 28% | 3,796 | 70% | 9,373 | 13,382 |
| Platte | 21% | 3,260 | 78% | 12,186 | 15,721 |
| -536 | 86% | 1st CD |
|
| Polk | 26% | 668 | 72% | 1,822 | 2,543 |
| Polk | 18% | 530 | 79% | 2,291 | 2,887 |
| -138 | 79% | 1st CD |
|
| Red Willow | 24% | 1,216 | 74% | 3,735 | 5,044 |
| Red Willow | 15% | 811 | 83% | 4,525 | 5,470 |
| -405 | 67% |
|
|
| Richardson | 38% | 1,513 | 59% | 2,342 | 3,968 |
| Richardson | 24% | 996 | 74% | 3,073 | 4,134 |
| -517 | 66% |
|
|
| Rock | 17% | 139 | 80% | 640 | 801 |
| Rock | 10% | 84 | 88% | 744 | 842 |
| -55 | 60% |
|
|
| Saline | 51% | 2,674 | 46% | 2,434 | 5,251 |
| Saline | 34% | 1,986 | 63% | 3,631 | 5,780 |
| -688 | 74% |
|
|
| Sarpy | 41% | 28,010 | 57% | 38,816 | 68,022 |
| Sarpy | 43% | 41,206 | 54% | 51,979 | 96,193 |
| 13,196 | 147% | 1st CD – part | 2nd CD – part |
| Saunders | 37% | 3,767 | 61% | 6,188 | 10,212 |
| Saunders | 26% | 3,331 | 71% | 9,108 | 12,786 |
| -436 | 88% | 1st CD |
|
| Scotts Bluff | 32% | 4,745 | 66% | 9,708 | 14,730 |
| Scotts Bluff | 27% | 4,196 | 71% | 10,952 | 15,524 |
| -549 | 88% |
|
|
| Seward | 36% | 2,703 | 62% | 4,647 | 7,529 |
| Seward | 27% | 2,438 | 71% | 6,490 | 9,199 |
| -265 | 90% | 1st CD |
|
| Sheridan | 18% | 454 | 79% | 1,941 | 2,462 |
| Sheridan | 13% | 340 | 85% | 2,292 | 2,684 |
| -114 | 75% |
|
|
| Sherman | 37% | 585 | 60% | 950 | 1,572 |
| Sherman | 20% | 343 | 78% | 1,322 | 1,700 |
| -242 | 59% |
|
|
| Sioux | 16% | 117 | 82% | 603 | 732 |
| Sioux | 10% | 72 | 88% | 642 | 731 |
| -45 | 62% |
|
|
| Stanton | 27% | 664 | 71% | 1,781 | 2,495 |
| Stanton | 17% | 532 | 81% | 2,561 | 3,165 |
| -132 | 80% | 1st CD |
|
| Thayer | 32% | 860 | 66% | 1,749 | 2,659 |
| Thayer | 21% | 624 | 77% | 2,308 | 2,989 |
| -236 | 73% |
|
|
| Thomas | 13% | 51 | 85% | 331 | 390 |
| Thomas | 11% | 45 | 88% | 377 | 427 |
| -6 | 88% |
|
|
| Thurston | 53% | 1,120 | 46% | 972 | 2,126 |
| Thurston | 47% | 1,122 | 50% | 1,180 | 2,379 |
| 2 | 100% | 1st CD |
|
| Valley | 29% | 706 | 68% | 1,657 | 2,423 |
| Valley | 18% | 412 | 81% | 1,901 | 2,344 |
| -294 | 58% |
|
|
| Washington | 36% | 3,711 | 62% | 6,425 | 10,300 |
| Washington | 29% | 3,554 | 69% | 8,583 | 12,467 |
| -157 | 96% | 1st CD |
|
| Wayne | 33% | 1,249 | 66% | 2,503 | 3,808 |
| Wayne | 24% | 1,022 | 72% | 3,055 | 4,218 |
| -227 | 82% |
|
|
| Webster | 30% | 552 | 68% | 1,233 | 1,817 |
| Webster | 18% | 335 | 81% | 1,511 | 1,876 |
| -217 | 61% |
|
|
| Wheeler | 22% | 96 | 76% | 334 | 440 |
| Wheeler | 12% | 59 | 87% | 438 | 503 |
| -37 | 61% |
|
|
| York | 24% | 1,607 | 74% | 4,848 | 6,568 |
| York | 23% | 1,630 | 75% | 5,337 | 7,161 |
| 23 | 101% |
|
|
1
posted on
12/08/2021 2:51:36 PM PST
by
kiryandil
To: kiryandil
To: kiryandil
3
posted on
12/08/2021 3:02:18 PM PST
by
sam_whiskey
(Peace through Strength. )
To: kiryandil
Easy to see where there steal tactics were applied.
4
posted on
12/08/2021 3:07:18 PM PST
by
immadashell
(New Planned Parenthood slogan: Black Babies’ Lives Don't Matter!c)
To: kiryandil
Are you saying in some places there were more votes than in 2008? Is that a problem?
I assume there has been some population growth in 12 years.
5
posted on
12/08/2021 3:07:53 PM PST
by
Renfrew
To: Renfrew
Almost all the counties show a consistent pattern with the exception of a few counties which are way out of whack. It doesn’t prove voter fraud per se` but shows that there may be irregularities.
6
posted on
12/08/2021 3:12:35 PM PST
by
DMD13
To: sam_whiskey
This is just a data post. I'll use it in the main post, which will contend that the Demoscats stole an electoral vote in Nebraska in 2020.
The trouble with my previous posts on these things is that there's too much data, and it obscures the point of the main post.
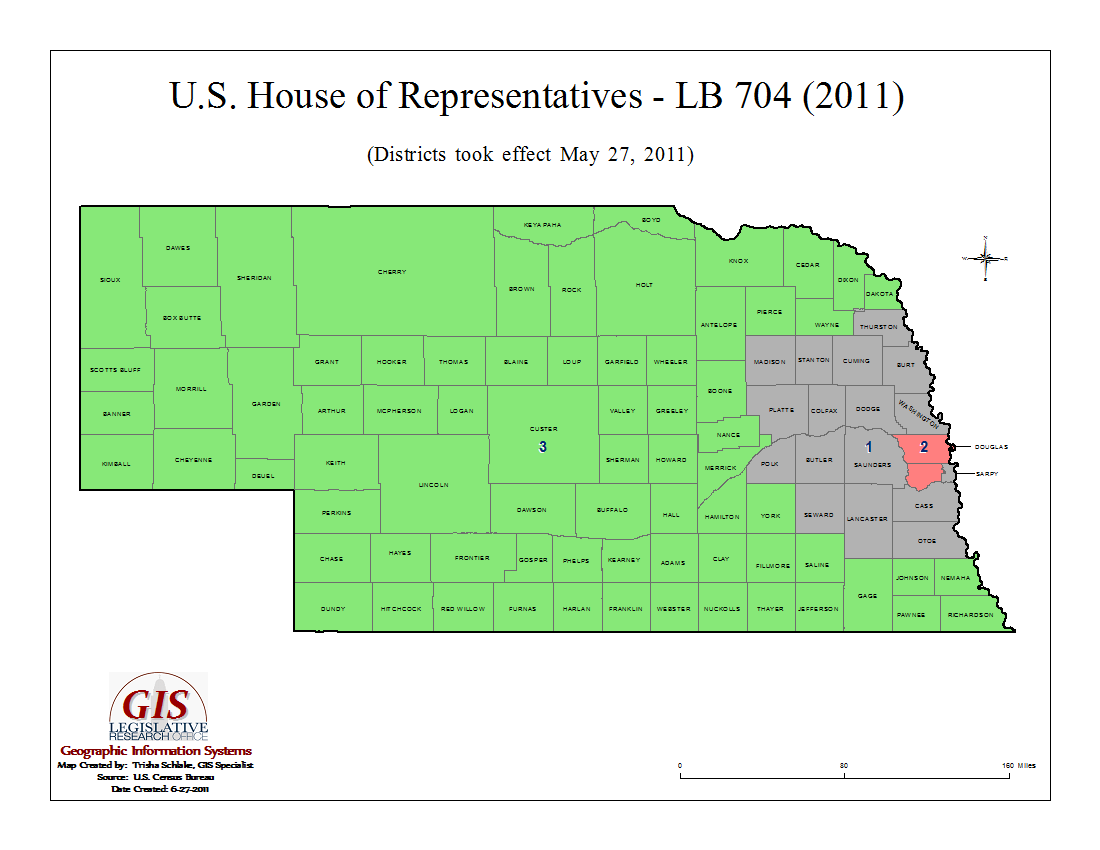
As you can see in the table above, the two counties in the 2nd Congressional district of Nebraska, Douglas County and Sarpy County, had an ENORMOUS number of votes for Biden (roughly 36,000) more in 2020 than for Obama in the 2008 election.
If you examine the rest of the table, the rest of the state was asleep in 2020 while the Busy Democrat Bees in Douglas and Sarpy were working overtime in their enthusiasm to get out the "vote".
Except that the Busy Bees, while remembering to get that Biden vote in, forgot to vote for the Democrat congressional candidate in CD 2...
That's right - the Democrat House candidate LOST.
7
posted on
12/08/2021 3:13:13 PM PST
by
kiryandil
(China Joe and Paycheck Hunter - the Chink in America's defenses)
To: Renfrew; DMD13
This is just a data post. I'll use it in the main post, which will contend that the Demoscats stole an electoral vote in Nebraska in 2020.
The trouble with my previous posts on these things is that there's too much data, and it obscures the point of the main post.
As you can see in the table above, the two counties in the 2nd Congressional district of Nebraska, Douglas County and Sarpy County, had an ENORMOUS number of votes for Biden (roughly 36,000) more in 2020 than for Obama in the 2008 election.
If you examine the rest of the table, the rest of the state was asleep in 2020 while the Busy Democrat Bees in Douglas and Sarpy were working overtime in their enthusiasm to get out the "vote".
Except that the Busy Bees, while remembering to get that Biden vote in, forgot to vote for the Democrat congressional candidate in CD 2...
That's right - the Democrat House candidate LOST.
8
posted on
12/08/2021 3:14:31 PM PST
by
kiryandil
(China Joe and Paycheck Hunter - the Chink in America's defenses)
To: kiryandil
Read later. Omaha, NE voted for Biden in a red state.
9
posted on
12/08/2021 3:15:10 PM PST
by
NetAddicted
( Just looking)
To: sam_whiskey
To me it seems as though some of these places voted in much, much higher numbers for biden in 2020 than obama in 2008.
This is suspicious to me- are you going to believe mccain, coming off a GWB presidency which was at its lowest in 2008, was garnering more support than Donald Trump in 2020??
10
posted on
12/08/2021 3:17:01 PM PST
by
God luvs America
(63.5 million pay no income tax and vote for DemoKrats...)
To: God luvs America
11
posted on
12/08/2021 3:21:03 PM PST
by
kiryandil
(China Joe and Paycheck Hunter - the Chink in America's defenses)
To: kiryandil
I don’t quite see what you’re trying to show. Only in Saline County are the vote percentages very different from 2008.
What are the 2008 vote totals for Obama and McCain and what are the vote totals for 2020 for Biden and Trump?
I did an analysis myself based on all of the counties won by Obama and Biden. Obama won 79,927 votes per county won. Biden won 147,250 votes per county won. It stretches believability that the election was fair pretty far.
BTW, there are 3,141 counties in the U.S. and Trump won 2,589 of them and Biden won only 552 of them.
12
posted on
12/08/2021 3:22:13 PM PST
by
libertylover
(Our biggest problem, by far, is that most of the media is hate & agenda driven, not truth driven.)
To: kiryandil
13
posted on
12/08/2021 3:26:03 PM PST
by
Renfrew
To: Renfrew
Science says that 129% to 149% of registered voters cannot vote.
Australia which has MANDATORY voting considers 90% turnout a huge success. But apparently Omaha is so patriotic that more than 120% of registered voters shows up to vote!
14
posted on
12/08/2021 3:28:46 PM PST
by
DesertRhino
(Dogs are called man's best friend. Moslems hate dogs. Add it up....)
To: kiryandil
How exactly can you get greater than 100% turnout? There is no election day registration.
Nebraska voter registration deadlines;
In Person: 11 days before Election Day.
By Mail: Postmarked 18 days before Election Day. Received 14 days before Election Day, if there’s an illegible postmark.
Online: 18 days before Election Day
Election Day Registration: N/A
15
posted on
12/08/2021 3:32:40 PM PST
by
DesertRhino
(Dogs are called man's best friend. Moslems hate dogs. Add it up....)
To: Renfrew
It is a fast growing country and has 50% more people than in 2008. Make perfect sense 47% more people would have voted. Remember, the population increase also includes children, who can't vote.
I worked Census, so I take these things into account.
16
posted on
12/08/2021 3:37:25 PM PST
by
kiryandil
(China Joe and Paycheck Hunter - the Chink in America's defenses)
To: kiryandil
So, we’re supposed to believe that Democrat enthusiasm and turnout was lower almost everywhere, but in heavily Democrat counties turnout exploded?
I poll-watched in the most heavily black precinct in a Democrat-controlled county in Illinois, and turnout was down 12%. The precinct next door, the 2nd most heavily black precinct in the county, had turnout that was also down double digits. But black turnout surged in 6 large counties in just the right places—swing states—to barely eke out a win for Brandon? And the votes didn’t materialize until after those areas stopped counting (as always happens in close races in Illinois when the Democrats are going to steal it—just ask Rod Blagojevich, who knows a thing or two about Democrat corruption)?
I don’t believe Brandon’s win was legit. Never will.
To: DesertRhino; Renfrew
How exactly can you get greater than 100% turnout? There is no election day registration. It's not turnout that's greater than 100%.
It's turnout that's ABOVE the Obama 2008 record turnouts.
Notice that this only happens where it's necessary - in several key counties.
Coupled with the news that Brandon's DOJ thugs are targeting the Nebraska CD-1 incumbent Republican, it's beginning to look like this stuff is being directed at the national level.
18
posted on
12/08/2021 3:47:48 PM PST
by
kiryandil
(China Joe and Paycheck Hunter - the Chink in America's defenses)
To: kiryandil
A fake election has given us a fake President.
19
posted on
12/08/2021 3:53:20 PM PST
by
central_va
(I won't be reconstructed and I do not give a damn...)
To: Renfrew
Sarpy County decennial census numbers
2000	122,595		19.5%
2010	158,840		29.6%
2020	190,604		20.0%
growth from 2010 to 2020:
190,604 - 158,840 = 31,764
growth from 2000 to 2010:
158,840 - 122,595 = 36,245 / 10 = 3,625 x 2 = 7,250
31,746 + 7,250 = 38,996 (roughly 40,000)
An increase of around 20,000 to 25,000 voters, if we're on the generous side.
20
posted on
12/08/2021 4:04:02 PM PST
by
kiryandil
(China Joe and Paycheck Hunter - the Chink in America's defenses)
Navigation: use the links below to view more comments.
first 1-20, 21-29 next last
Disclaimer:
Opinions posted on Free Republic are those of the individual
posters and do not necessarily represent the opinion of Free Republic or its
management. All materials posted herein are protected by copyright law and the
exemption for fair use of copyrighted works.
FreeRepublic.com is powered by software copyright 2000-2008 John Robinson