Posted on 10/06/2014 7:51:44 PM PDT by 2ndDivisionVet
In a strange twist of fate, two age-old Civil Rights cases collide in Ferguson, MO -- half a century later. Is it just coincidence? Or could there be a deeper subliminal message lying tucked between the levels of America's consciousness? I decided to take a closer look.
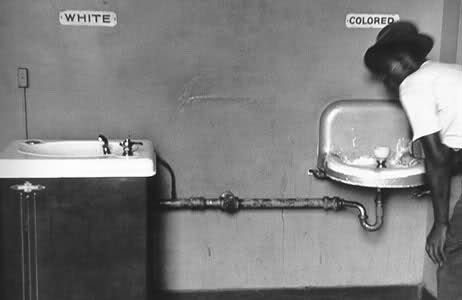
Forever connected, yet perched on the opposite ends of the spectrum, Plessy v. Ferguson (1896) and Brown v. Board of Education (1954) are two landmark Supreme Court cases in the fight for African-American civil rights. The former case legalized racial segregation under the "separate but equal" law, while the latter case outlawed the doctrine.
In the immediate aftermath of the Brown v. Board of Education decision, the United States Army and National Guard were called to duty across the south to facilitate the enforcement of the ruling -- helping students of color register at previously all-white schools. However, most schools sprinkled in just enough color to be in compliance with no regard for full integration.
Fast forward sixty years. In 2014, the same "sprinkle in just enough color to be in compliance" practice is prevalent throughout our local and federal government, Corporate America, academia and beyond....
(Excerpt) Read more at huffingtonpost.com ...
Ah, yes, more agitprop from the HuffingGlue Post. Yawn...
To those people who say there are not two different standards for citizenship, I point out that the Wong/Plessy court explicitly said there is.
Other large cities are practically identical racial segregation.
 |
 |
 America demands Justice for the Fallen of Benghazi! |
 |
 |
Sorry. It’s Brown vs. Board of Education and Plessy vs. Ferguson. ;-)
See the article.
It’s a joke. That’s why I winked. :-)
LOL. I probably should have.
I don’t always notice that since I don’t use them.
We are the same race of people that find ourselves locked behind bars at a rate that is unparallel to any other race.
Compared to the population of your race yes vs. all other races.. but in pure numbers whites beat ya nowadays. Table 349. Jail Inmates by Sex, Race, and Hispanic Origin: 1990 to 2009 [Data for 2000 and 2007 – 2009 are based on the Annual Survey of Jails]
| Characteristic | 1990 | 1995 | 2000 | 2005 | 2007 | 2008 | 2009 | |||||||
|---|---|---|---|---|---|---|---|---|---|---|---|---|---|---|
| Total inmates1,2 | 405,320 | 507,044 | 621,149 | 747,529 | 780,174 | 785,536 | 767,434 | |||||||
| Incarceration rate* | 163 | 193 | 220 | 252 | 259 | 258 | 250 | |||||||
| Rated capacity3,4 | 389,171 | 545,763 | 677,787 | 786,954 | 810,543 | 828,714 | 849,895 | |||||||
| Adult | 403,019 | 499,300 | 613,534 | 740,770 | 773,341 | 777,832 | 760,216 | |||||||
| Male | 365,821 | 448,000 | 543,120 | 646,807 | 673,346 | 678,660 | 667,039 | |||||||
| Female | 37,198 | 51,300 | 70,414 | 93,963 | 99,995 | 99,172 | 93,176 | |||||||
| Juveniles5 | 2,301 | 7,800 | 7,615 | 6,759 | 6,833 | 7,703 | 7,218 | |||||||
| White, non-Hispanic | 169,600 | 203,300 | 260,500 | 331,000 | 338,200 | 333,300 | 326,400 | |||||||
| Black, non-Hispanic | 172,300 | 220,600 | 256,300 | 290,500 | 301,700 | 308,000 | 300,500 | |||||||
| Hispanic/Latino6 | 58,100 | 74,400 | 94,100 | 111,900 | 125,500 | 128,500 | 124,000 | |||||||
| Other6 | 5,400 | 8,800 | 10,200 | 13,000 | 13,900 | 14,000 | 14,800 | |||||||
Source: U.S. Department of Justice, Bureau of Justice Statistics, Jail Inmates at Midyear 2009, annual, Series NCJ 230112, June 2010. See also.
I believe these little tables are about federal prisons.. again whites beat ya in pure numbers 127,251 to 80,091.
Federal Bureau of Prisons Tables, August 2014
| Age | # of Inmates | % of Inmates |
|---|---|---|
| Under 18 | 35 | 0.0% |
| 18-21 | 2,870 | 1.3% |
| 22-25 | 12,956 | 6.0% |
| 26-30 | 28,976 | 13.5% |
| 31-35 | 40,449 | 18.8% |
| 36-40 | 38,633 | 18.0% |
| 41-45 | 31,882 | 14.8% |
| 46-50 | 22,839 | 10.6% |
| 51-55 | 16,220 | 7.6% |
| 56-60 | 9,750 | 4.5% |
| 61-65 | 5,548 | 2.6% |
| 65 | 4,541 | 2.1% |
| Native Country | ||
|---|---|---|
| # of Inmates | % of Inmates | |
| Colombia | 2,023 | 0.9% |
| Cuba | 1,452 | 0.7% |
| Dominican Republic | 2,077 | 1.0% |
| Mexico | 36,236 | 16.9% |
| Other/Unknown | 10,672 | 5.0% |
| United States | 162,239 | 75.6% |
| Ethnicity | # of Inmates | % of Inmates |
|---|---|---|
| Hispanic | 74,338 | 34.6% |
| Non-Hispanic | 140,361 | 65.4% |
| Gender | # of Inmates | % of Inmates |
|---|---|---|
| Female | 14,314 | 6.7% |
| Male | 200,385 | 93.3% |
| Race | # of Inmates | % of Inmates |
|---|---|---|
| Asian | 3,316 | 1.5% |
| Black | 80,091 | 37.3% |
| Native American | 4,041 | 1.9% |
| White | 127,251 | 59.3% |
| Sentence | # of Inmates | % of Inmates |
|---|---|---|
| Less than 1 year | 6,668 | 2.3 % |
| 1-3 years | 23,891 | 11.8% |
| 3-5 years | 27,130 | 13.4% |
| 5-10 years | 51,460 | 25.4% |
| 10-15 years | 40,988 | 20.3% |
| 15-20 years | 22,265 | 11.0% |
| More than 20 years | 24,450 | 12.1% |
| Life | 5,493 | 2.7% |
| Death | 58 | 0.0% |
| Offense | # of Inmates | % of Inmates |
|---|---|---|
| Banking and Insurance, Counterfeit, Embezzlement | 724 | 0.4% |
| Burglary, Larceny, Property Offenses | 7,913 | 3.9% |
| Continuing Criminal Enterprise | 454 | 0.2% |
| Courts or Corrections | 827 | 0.4% |
| Drug Offenses | 98,964 | 48.8% |
| Extortion, Fraud, Bribery | 12,428 | 6.1% |
| Homicide, Aggravated Assault, and Kidnapping Offenses | 5,775 | 2.9% |
| Immigration | 20,853 | 10.3% |
| Miscellaneous | 1,545 | 0.8% |
| National Security | 81 | 0.0% |
| Robbery | 7,514 | 3.7% |
| Sex Offenses | 13,329 | 6.6% |
| Weapons, Explosives, Arson | 32,203 | 15.9% |
| Security Level | # of Inmates | % of Inmates |
|---|---|---|
| Minimum | 36,787 | 17.1% |
| Low | 83,753 | 39.0% |
| Medium | 62,586 | 29.2% |
| High | 24,036 | 11.2% |
| Unclassified | 7,537 | 3.5% |
Looks like black utes win the next one for ya.
| Juvenile Arrest Rate Trends |
Juvenile Arrest Rates for Violent Crime Index offenses by Race, 1980-2011
| Year | Whites | Blacks | American Indians |
Asians | |||||
|---|---|---|---|---|---|---|---|---|---|
| 1980 | 172.5 | 1,040.0 | 204.9 | 118.5 | |||||
| 1981 | 165.5 | 1,092.5 | 160.1 | 98.8 | |||||
| 1982 | 168.5 | 1,044.8 | 203.8 | 105.8 | |||||
| 1983 | 156.7 | 1,014.9 | 160.6 | 89.3 | |||||
| 1984 | 156.5 | 1,015.2 | 152.1 | 81.8 | |||||
| 1985 | 169.3 | 1,036.9 | 182.2 | 81.8 | |||||
| 1986 | 175.1 | 1,076.3 | 174.2 | 81.1 | |||||
| 1987 | 167.9 | 1,058.9 | 183.5 | 85.6 | |||||
| 1988 | 192.5 | 1,164.1 | 217.6 | 113.6 | |||||
| 1989 | 225.6 | 1,337.6 | 216.1 | 108.7 | |||||
| 1990 | 247.6 | 1,373.2 | 223.2 | 128.5 | |||||
| 1991 | 272.8 | 1,391.9 | 226.9 | 143.2 | |||||
| 1992 | 279.5 | 1,456.9 | 248.1 | 146.0 | |||||
| 1993 | 288.7 | 1,531.0 | 281.4 | 156.8 | |||||
| 1994 | 307.3 | 1,600.1 | 322.1 | 180.7 | |||||
| 1995 | 302.8 | 1,552.4 | 327.0 | 175.3 | |||||
| 1996 | 284.3 | 1,291.2 | 288.0 | 185.4 | |||||
| 1997 | 265.0 | 1,137.3 | 264.7 | 163.2 | |||||
| 1998 | 247.1 | 984.8 | 247.3 | 136.3 | |||||
| 1999 | 226.4 | 871.7 | 225.0 | 121.2 | |||||
| 2000 | 210.3 | 817.3 | 200.0 | 111.8 | |||||
| 2001 | 203.9 | 790.6 | 173.9 | 99.3 | |||||
| 2002 | 190.3 | 738.4 | 182.0 | 92.2 | |||||
| 2003 | 181.1 | 747.1 | 158.1 | 83.8 | |||||
| 2004 | 177.6 | 738.7 | 156.4 | 72.6 | |||||
| 2005 | 175.2 | 823.3 | 155.3 | 67.1 | |||||
| 2006 | 180.0 | 875.2 | 173.7 | 74.0 | |||||
| 2007 | 175.3 | 842.4 | 146.0 | 69.2 | |||||
| 2008 | 172.4 | 861.9 | 118.1 | 63.1 | |||||
| 2009 | 155.6 | 780.3 | 118.8 | 59.1 | |||||
| 2010 | 140.6 | 683.9 | 114.2 | 46.1 | |||||
| 2011 | 125.5 | 627.4 | 104.7 | 40.8 | |||||
| Year | Whites | Blacks | American Indians |
Asians |
| Note: Rates are arrests of persons ages 10-17 per 100,000 persons ages 10-17 in the resident population. Persons of Hispanic ethnicity may be of any race, i.e., white, black, American Indian, or Asian. Arrests of Hispanics are not reported separately. The Violent Crime Index includes the offenses of murder and nonnegligent manslaughter, forcible rape, robbery, and aggravated assault. |
Again whites beat ya.. more of us are victims of police homicide than you.
The FBI and other sources homicide by law enforcement figures below include the majority of all police departments.
The point of this reply is to point out that whites are the most likely to die while being arrested for example.
The Obama-Holder U.S. Dept. Just Us and the race-grievance industry will of course exploit all shootings to the max vis-a-vis race more than any concern for the poor victim.
The ARD data show that whites are more likely to die while being arrested and IMO there is no doubt that some of those deaths were the intention of the police.
What about the larger number of whites and Arrest-Related Deaths (ARD)? Why is that okay with Obama, the race-grievance industry, and the media? We never see coverage of questionable ARDs involving whites that's anything close to Ferguson for example.
Especially.. forget race, what about Ms Carey the young woman chased, surrounded and gunned down by federal agents in D.C.? Where's Obama-Holder caring about her and her baby?
Arrest-Related Deaths, 2003-2009 - Statistical Tables
"From 2003 through 2009, a total of 4,813 deaths were reported to the Bureau of Justice Statistics’ (BJS) Arrest-Related Deaths (ARD) program."
Of these, about 6 in 10 deaths (2,931) were classified as homicide by law enforcement personnel, and 4 in 10 (1,882) were attributed to other manners of death.
Table 1 Number of reported arrest-related deaths, by manner of death, 2003-2009
| Manner of death | 2003-2009 | 2003 | 2004 | 2005 | 2006 | 2007 | 2008 | 2009 |
|---|---|---|---|---|---|---|---|---|
| All manners | 4,813 | 627 | 673 | 689 | 721 | 745 | 629 | 729 |
| Homicide —by law enforcement | 2,931 | 376 | 375 | 377 | 447 | 455 | 404 | 497 |
| by other persons | 27 | 3 | 4 | 4 | 2 | 7 | 3 | 4 |
| Suicide | 541 | 60 | 84 | 82 | 67 | 78 | 76 | 94 |
| Intoxication | 525 | 83 | 83 | 90 | 76 | 89 | 54 | 50 |
| Accidental injury | 272 | 53 | 41 | 47 | 39 | 35 | 28 | 29 |
| Natural causes | 244 | 26 | 46 | 32 | 34 | 42 | 33 | 31 |
| Unknown | 273 | 26 | 40 | 57 | 56 | 39 | 31 | 24 |
Note: Due to variation in reporting, caution should be used in comparing counts from year to year. See Methodology for information on missing data by state for each year. Counts may differ from previous publication due to additional information.
Table 5 Number of reported arrest-related deaths, by manner of death and demographic characteristics, 2003-2009
| Demographic characteristics |
All manners | Homicide | Suicide | Intoxication | Accident | Natural causes | Unknown |
|---|---|---|---|---|---|---|---|
| Total | 4,813 | 2,958 | 541 | 525 | 272 | 244 | 273 |
| Sex | |||||||
| Male | 4,594 | 2,851 | 517 | 490 | 259 | 218 | 259 |
| Female | 218 | 107 | 24 | 35 | 13 | 26 | 13 |
| Unknown | 1 | 0 | 0 | 0 | 0 | 0 | 1 |
| Race/Hispanic origin | |||||||
| White, non-Hispanic | 2,026 | 1,233 | 327 | 178 | 95 | 110 | 83 |
| Black, non-Hispanic | 1,529 | 937 | 80 | 217 | 111 | 85 | 99 |
| Hispanic | 949 | 599 | 110 | 109 | 55 | 29 | 47 |
| Other* | 150 | 107 | 12 | 17 | 4 | 4 | 6 |
| Unknown | 159 | 82 | 12 | 4 | 7 | 16 | 38 |
| Age | |||||||
| 17 or younger | 127 | 99 | 6 | 5 | 13 | 0 | 4 |
| 18-24 | 909 | 685 | 80 | 53 | 54 | 10 | 27 |
| 25-34 | 1,391 | 893 | 140 | 177 | 65 | 41 | 75 |
| 35-44 | 1,238 | 658 | 159 | 190 | 78 | 66 | 87 |
| 45-54 | 752 | 390 | 105 | 84 | 45 | 75 | 53 |
| 55 or older | 317 | 188 | 44 | 11 | 12 | 52 | 10 |
| Unknown | 79 | 45 | 7 | 5 | 5 | 0 | 17 |
To me this shows that it is not a racial thing. It happens to all races. These figures however do not show those thought "murdered" by police. I have not yet located data for recent years. Why can't I find data for recent years? I do not know.. maybe the Dept of Just Us and Race-Grievance Industry don't want it known that whites are the most likely to die being arrested.
How about debatin' them table, Mr. Stuckey.
Yes, another vomitworthy hitpiece.
And yes, I believe that complete social and geograpical separation is needed.
We cannot get along. We have a culture who is almost completely dependent on the government for their bread and hearth; a government who takes it from the working who part with it very reluctantly and who will one day say “No more!”
Everyday they trot out new buzzwords like microaggression, white priviledge, and gentrification to cover their own failings with what they consider righteous indignation. I cannot think of one other culture, with the exception of muslims, who have thrown up such a smokescreen to their own inadequacies and failure to integrate.
At the finale of this drama, many cities will adopt policies that cause them to hire minorities who are substandard to be their police officers. They will become cesspools like Detroit and they will have their wish of a separate community run by people who look like them as the only criteria for competency.
” We cannot get along. We have a culture who is almost completely dependent on the government for their bread and hearth; a government who takes it from the working who part with it very reluctantly and who will one day say “No more!””
I believe it goes much deeper than culture... down to physical causes - genetic. The “Bell Curve” pretty much explains everything that we see going on in the world regarding races.
It is tragic and unfortunate that it is so, but denying reality only makes matter worse.
I’m convinced that two groups of people with significantly different AVERAGE IQs, AND easily identifiable traits (skin color, or other physical appearances) cannot coexist peacefully together.
The reason is due to human nature.
Most likely not the article’s intent, but a good question to which the answer is yes!
America’s biggest error was not slavery; it was allowing the freed slaves to remain, thus creating a resentful under-performing minority. We compounded this error by allowing (for no good reason) massive African immigration.
Disclaimer: Opinions posted on Free Republic are those of the individual posters and do not necessarily represent the opinion of Free Republic or its management. All materials posted herein are protected by copyright law and the exemption for fair use of copyrighted works.