Skip to comments.
Stunning Video Explanation – Dr Douglas Frank Shows How The 2010 Census Was Used to Create the Algorithm That Fabricated the 2020 Electronic Vote Outcome
Conservative Treehouse ^
| August 10, 2021
| Sundance
Posted on 08/11/2021 2:55:43 PM PDT by White Lives Matter
This is a stunning video and represents the best presentation to show how the 2020 election was determined; not by actual people voting but by algorithms inserted into election tabulation machines. {Direct Rumble Link}
Dr. Douglas G Frank explains information he discovered as he reviewed election outcomes. Dr. Frank found the baseline for the 2020 vote was created by applying an algorithm that used the 2010 census to fabricate the illusion of registered voters at a state level (predetermined) and then results are controlled at a county level.
Every state is impacted, and every county within the state generates the exact same age and voter registration ratio. So far they have identified 3,006 counties with the exact same predictable voter outcome and ratio. This really is a must watch:
(Excerpt) Read more at theconservativetreehouse.com ...
TOPICS: Front Page News; Government; News/Current Events; Politics/Elections
KEYWORDS: 2010census; bidenskeywordtrolls; cuespiracy; electionfraud2020; funpantsweehouse; mathdontlie; mikelindell; stolenelection; sundance; trump
Navigation: use the links below to view more comments.
first previous 1-20, 21-40, 41-58 last
He may be right, but he didn’t explain who decides the winners and if it was only in 2020 and that all those people voted. I believe it was stolen with ballots.
To: White Lives Matter
To: AdmSmith; AnonymousConservative; Arthur Wildfire! March; Berosus; Bockscar; cardinal4; ColdOne; ...
43
posted on
08/11/2021 9:29:03 PM PDT
by
SunkenCiv
(Imagine an imaginary menagerie manager imagining managing an imaginary menagerie.)
To: TakebackGOP
The “stolen with ballots” part is what Dr. Frank calls “the ground game.”
The machine-driven part is “the air game.”
They go hand-in-hand, but the ground game can be put into overdrive if the predictions used to set up your algorithm turn out to be off by a large amount. If your air game falls short of your desired result, your ground game injects the additional ballots you need.
From there, it’s just a matter of comparing voter rolls with the decade-shifted census data to determine the maximum number of votes you can fake.
44
posted on
08/12/2021 4:05:40 AM PDT
by
HKMk23
(Buffalo buffalo Buffalo buffalo buffalo buffalo Buffalo buffalo.)
To: HKMk23
He claimed everyone was registered and someone decides who will win.
To: White Lives Matter
1) At 4:25 he says that voters are being added to the voter registration database during the election and he only references Michigan. Michigan has same day voter registration so this is certainly expected and not a hack. He claims this occurs in all States and the packet captures show this, yet does not produce any packet captures.
More later
To: Rightwing Conspiratr1
At 10:30 he starts his explanation of the statistics.
At 12:11 the screen shot shows voter registration of Congressional district 04 in PA 535,556.
The data on the Pennsylvania State election site says there are 522,710 registered voters in Congressional district 04.
He also does not explain why he is using a Congressional district here when he claims this fraud is done at the County level.
Also I don't know his formula for interpolating the 2010 Census data. Anyway ignoring the data differences for a minute, and look at what he says about correlation.
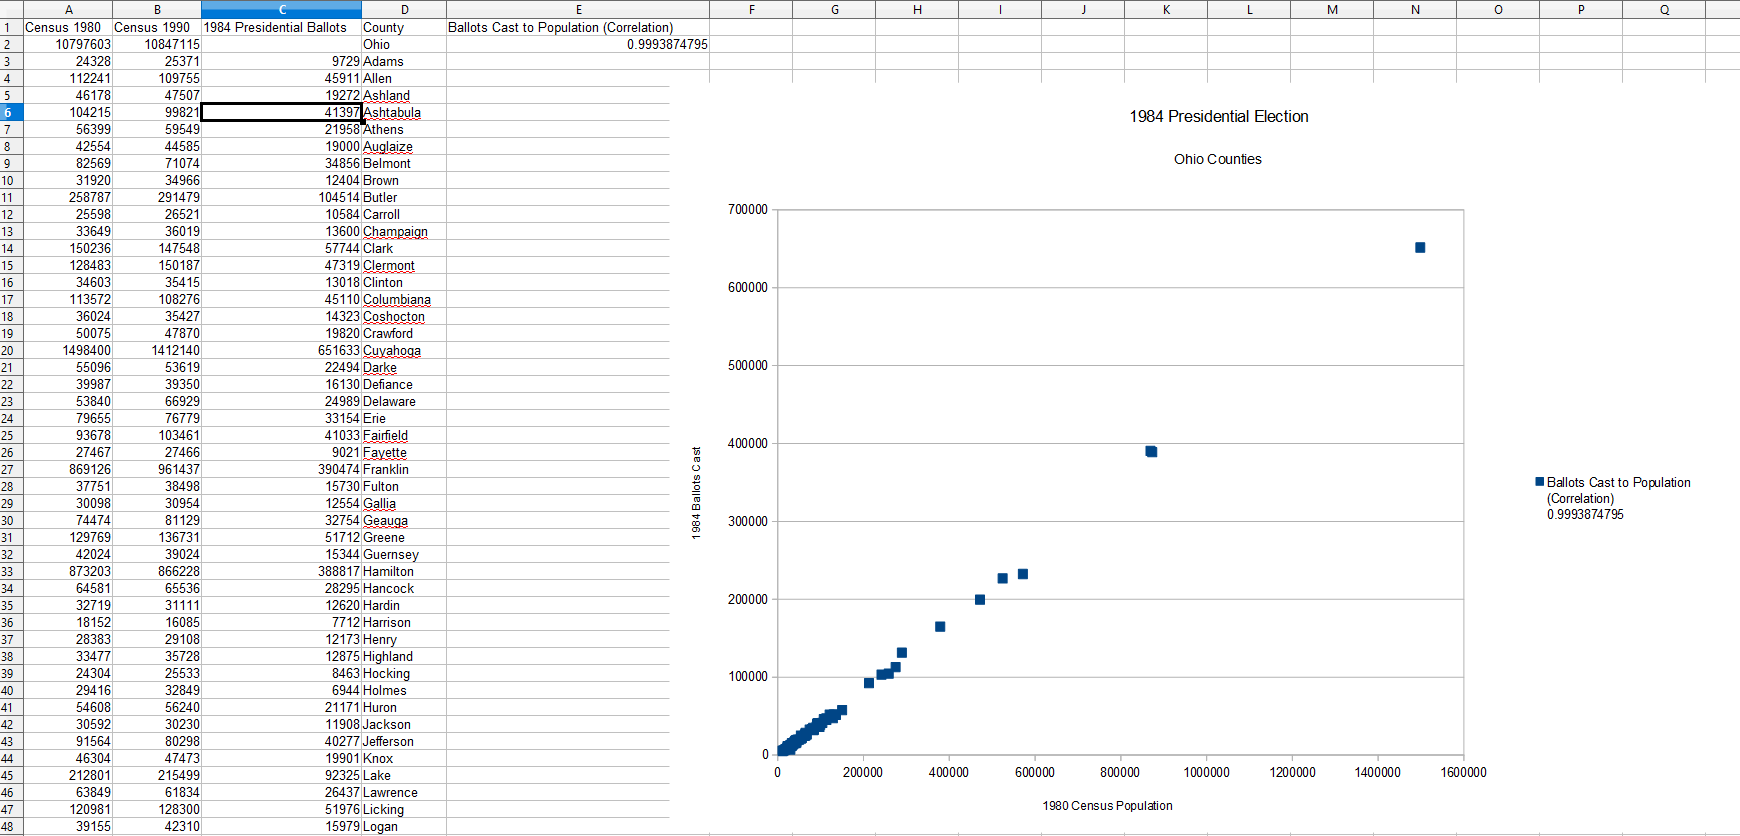
He claims the correlation between ballots cast and registered voters is unnatural because it so close to 1.0.
It's not at all unusual. It indicates that the correlation between the variables is strong and predictable.
In fact the correlation between ballots cast and the census data is very strong and predictable as well.
None of this is suspicious although he claims that. See The Correlation Coefficient. There are many more sites on the internet that explain correlation.
In order to show that I built a spreadsheet with 1980 census data and 1984 election results for all Ohio Counties. An a scatter plot graph to show just how strongly correlated the two variables are.
I will provide a link to the spreadsheet on OneDrive if anyone is interested.
To: Rightwing Conspiratr1
I used 1984 election data because that was the earliest by County information I could find. Also I voted in the election in Ohio on punch cards!
And it certainly predates any notions of election machinery being connected to the internet. And therefore proves this "unusual correlation" theory of Dr. Frank to be wrong.
To: White Lives Matter
This presentation was fascinating - the best thing I saw at the event (although I didn’t watch every minute of the Cyber “Supposium”, as Lindell says).
49
posted on
08/12/2021 8:50:55 PM PDT
by
MayflowerMadam
(While the foundations are being destroyed, what are the righteous doing?)
To: Revel
50
posted on
08/12/2021 8:51:48 PM PDT
by
MayflowerMadam
(While the foundations are being destroyed, what are the righteous doing?)
To: EasySt
Thanks for that synopsis.
51
posted on
08/12/2021 8:53:23 PM PDT
by
MayflowerMadam
(While the foundations are being destroyed, what are the righteous doing?)
To: Revel
52
posted on
08/12/2021 8:55:27 PM PDT
by
MayflowerMadam
(While the foundations are being destroyed, what are the righteous doing?)
To: White Lives Matter
53
posted on
08/14/2021 9:18:38 AM PDT
by
SaveFerris
(The Lord, The Christ, and The Messiah: Jesus Christ of Nazareth - http://www.BiblicalJusChrist.Com)
To: White Lives Matter
A short set of bullet points summarizing the contentions of the video would be appreciated.
To: Political Junkie Too
That said, if we had ended up with Romney (or McCain) we wouldn’t have had Trump—though we would have had less of Obama.
God’s ways are mysterious, man’s are annoying.
To: Political Junkie Too
Yep, many of us saw the same kinds of fraud in 2008 too (or even back in 2000). The only difference in 2020 was that their usual “subtle” methods of fraud were not enough to overcome the Trump landslide, and the left simply was not willing to eat another loss like Hillary’s. So they abandoned subtlety altogether.
To: White Lives Matter
How did Iowa go from a blue state to solid red?
If there is a documentary I would like to see it.
57
posted on
08/18/2021 3:21:21 PM PDT
by
Kenny500c
( )
To: White Lives Matter
Studies like this demonstrate the need for paper ballots -there is no need for instant network projections.
58
posted on
08/18/2021 3:29:38 PM PDT
by
Kenny500c
( )
Navigation: use the links below to view more comments.
first previous 1-20, 21-40, 41-58 last
Disclaimer:
Opinions posted on Free Republic are those of the individual
posters and do not necessarily represent the opinion of Free Republic or its
management. All materials posted herein are protected by copyright law and the
exemption for fair use of copyrighted works.
FreeRepublic.com is powered by software copyright 2000-2008 John Robinson