Then by damn, let’s start turning them over!
l8r
Is there a pattern?
The “Steal” was worst in 4 states, Pennsylvania, Wisconson, Michigan, and Georgia.
▶️All four states used Dominion software
▶️All four states stopped counting votes on the night of the election for no apparent reason
▶️ All four states locked out poll watchers during and after stoppage
▶️All four states Trump had a sizable vote lead at the time of vote stoppage
▶️ All four states continued vote counting during announced stoppage
▶️ All four states witnesses saw ballots being delivered during the night
▶️All four states had large spike in vote blocks for Biden arrive in the middle of the night (Ballot stuffing)
▶️All four states had shifts in the percentage of votes being counted towards Biden after the election and after 90% or more of the votes had already been counted (Algorithm changed)
▶️All four the voting irregularities were identified in metro Democrat areas.
▶️All four states were won by Trump in 2016
▶️ All four states the nightime Biden block votes were for Biden only and not down ticket offices
▶️ All four states the metro voter turnout was statistically impossible (Greater than voter registrations and/or population in district)
▶️ All four states allowed Democrat only correction of ballots with errors
▶️ All four states the voting irregularities were always favoring Biden.
Please add to this list
Bump for later analysis.
States and percentages of voters OVER 100%. NV 125, PA 109, MN 107, NC 106, WI 105, MI 105, AZ 101 and GA 96. Statistically impossible. Should have a redo.
[Election Findings Could ‘Easily’ Overturn 3 States, Data Analyst Concludes......]
It certainly should. At LEAST 3 states.
[Election Findings Could ‘Easily’ Overturn 3 States, Data Analyst Concludes......]
It certainly should. At LEAST 3 states.
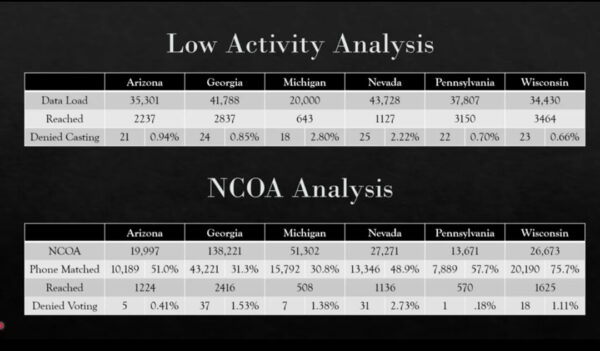
“ In Georgia, the team found 138,221 such people, which represents a much larger number than the state’s current vote differential (12,670) in the presidential race.”
____________________
SoS Brad Raffensperger and Gov. Brian Kemp must be punished. This is just a single attribute of election fraud they committed.
27November2020...Vote Trajectory Theory
I’ve been reviewing some of the literature and science of ‘shapes’ including triangles to dodecahedrons - which is way over my head - as it can be applied to the Social or Political Sciences in modeling which is anything but an exact science. So, I’ve been working on a less ambitious, but nevertheless infinitely more applicable exercise which I call the ‘Vote Trajectory Theory’ where you can devise a mathematical model on the ‘trip’ of a single vote and the multiple intersections for ‘vote deflection’ from a single individual resulting in an eventual weighted outcome and effect. Of course the constant variables would be affected and controlled by the structure and the infinite number of rules devised which would in the ‘real’ mathematical world lead to a predictable outcome. The long and the short would be something like this: Whoever constructs the STRUCTURE for ANYTHING and ultimately Whoever makes the RULES for that particular ANYTHING can determine the OUTCOME of that specific action. The problem I’m having is assigning weighted values for for the variables that are or can be introduced during the ‘journey’ of a single vote along its intended trajectory despite the voters original intentions by merely interjection of RULES within a STRUCTURE made by someone other than the voter themselves. It’s a ‘fun’ exercise without any end in sight...standby... this is going to take a minute...
I would like to see information such as this on a widely-used public forum, such as Wikipedia. They are biased against Trump, they don’t permit original research, and they require all facts to be from reliable sources, but I think it can be done (at least partially).
To take a simple example: the Wikipedia article “2020 United States presidential election”, in the “Results by state” section, has a “Total votes” column. It could also have a “Registered voters” column for the number of registered voters, and a percentage column showing the proportion of registered voters who actually voted. This might show anomalously high percentages in the swing states.
The next step might be to show the corresponding sets of figures for each county in the state. (I looked up the Wikipedia article on Georgia, and it shows the total votes cast for each county. But that is not true for Michigan.)
And then at a still more detailed level.
The ban on original research might prevent comparing the average for the swing states with the average for the remaining states, but a graph, with an appropriate choice of scale, should be acceptable and could drive the point home (especially if the previous election figures are shown for comparison and they are noticeably different).
The requirement for reliable sources could be difficult because of the bias of the mainstream media, but small local media should be acceptable, and might even be more likely to publish the more detailed data.
the really important thing about that analysis, is that it should automatically take the issue out of those states hands and courts.
It obviously is an external assault upon those states=-making it a Federal issue
Yeah we’ll see how easy it is.
later
FWIW, I think Trump needs 4 to win; but losing 3 would cost Biteme the 270
Hmmm...Epoch Times...ONE reporter...conclusion? REAL news.
PFL