
Posted on 08/03/2013 4:04:52 PM PDT by grundle
A new peer-reviewed paper published in Energy & Environment analyzes 24 years of data from the European Meteosat weather satellite and finds global temperatures decreased over the period 1982-2006. According to the authors, “Our observations point to a decrease in planetary temperature over almost the entire hemisphere, most likely due to an increase of cloudiness.”
“The cloud filtered temperature change patterns, in figure 2c, indicate that the largest decrease occurs in the more cloudy regions of the hemisphere: the tropics and the temperate zones, while in the desert belt the temperature decrease is much smaller. This suggests that cloudiness changes could be the mechanism behind the observed global cooling since 1982: an increase in cloudiness would decrease global radiation and increase rainfall and evapotranspiration. Both effects tend to decrease the surface temperature.”
Full paper available here
Meteosat Derived Planetary Temperature Trend 1982-2006
Andries Rosema1, Steven Foppes1, Joost van der Woerd1
1EARS Earth Environment Monitoring Ltd., Delft, the Netherlands Kanaalweg 1, 2628 EB Delft, the Netherlands
Abstract
24 year of Meteosat hourly thermal infrared data have been used to study planetary surface temperature change. Thermal infrared radiation in the 10.5-12.5mm spectral window is not affected by CO2 and only slightly by atmospheric water vapor. Satellite thermal infrared data have been converted to brightness temperatures as prescribed by Eumetsat. Hourly brightness temperature images were then composed to corresponding noon and midnight temperature data fields. The resulting data fields were cloud filtered using 10, 20 and 30 day maximum temperature substitution. Filtered data were subsequently averaged for two 10 yearly periods: 1986-1995 and 1996-2005. Finally the change in brightness temperature was determined by subtraction. In addition nine locations were selected and data series were extracted and studied for the period 1982-2006. Our observations point to a decrease in planetary temperature over almost the entire hemisphere, most likely due to an increase of cloudiness. Two small areas are found where a considerable temperature increase has occurred. They are explained in terms of major human interventions in the hydrological balance at the earth surface.
bump
this will be totally unnewsworthy to the MSM
These Dutch scientists will now be entered into a witness protection program.


Owl Bore is going to FLIP OUT!
Stay out of the path of flying saliva.
That is where they went wrong, it is the models that are important, not historical measurable data.
This observation backs up this theory:

lets see if we can break this down
CO2 is loved by plants, so much that it enhances plant growth (can we spell GREEN)
increaseed plant growth increases the take-up of water into plants, where it is not only used but also from where it evaporates
greater evaporation from more green plants increases atmospheric water vapor, which contributes to building clouds
more clouds shields more surface from sunlight and reflects more sunlight back out of earth’s atmosphere
so, laboratory chemistry and ICCP models aside, does it automatically follow that increased CO2 means higher earth temps???
simplistic and missing some of the science, I know,
but its as logical as “man made” “global warming”
Thanks grundle.
and it will also be ignored by those here who believe that global warming is real.
There are freepers who still believe that?
Good data, but bad assumption on cause. Decreased solar output due to natural solar long duration cycling is the #1 cause of our temperature changes.
they demand evidence when yousay there isn’t any global warming he last 25 years.
this isn’t the only study/data out there that says this.
Of course they are! If the left says hot, you can bet the bank it is cold.
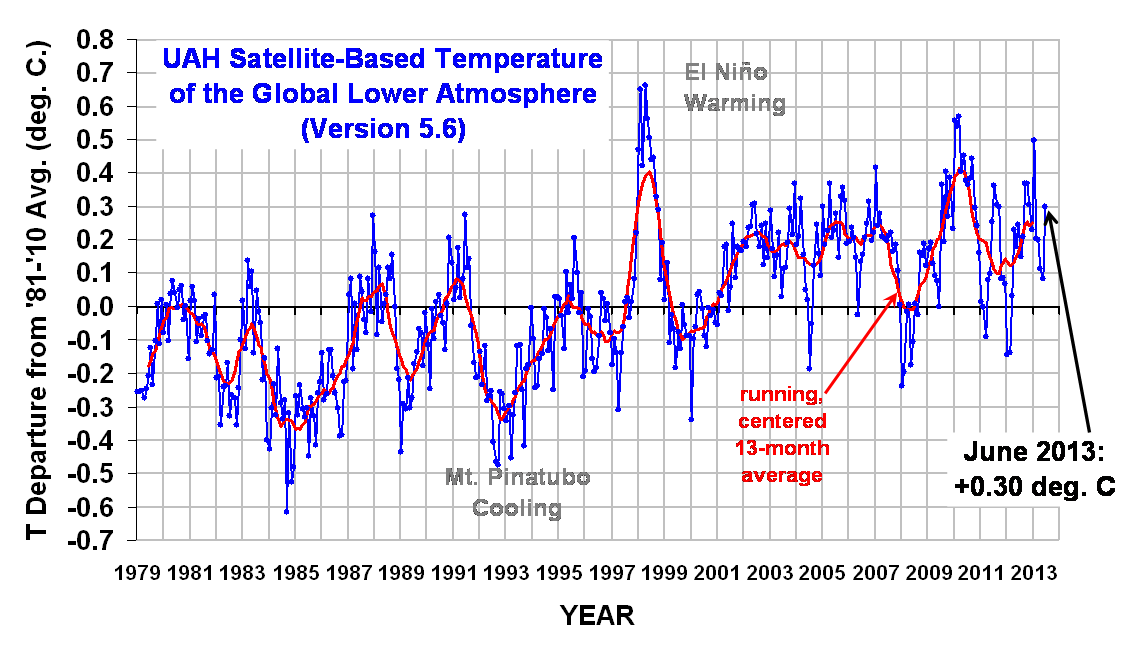
I never demand evidence of non-warming or of cooling, but I generally point out that there is evidence of warming like this:
A few caveats though. It's not a temperature measurement but an estimate derived from fairly complex outgoing radiation measurements. Also that interval starts with cooling from the eruption of El Chichon in 1982 which probably cooled the planet about 0.2C But even with that and Pinatubo, there is some warming over the interval.
You know how those flying machines lie.
/s
Weaker solar activity usually means weaker solar wind. The solar wind makes it more difficult for cosmic rays to reach Earth. So a declining solar wind output means more cosmic rays enter Earth's atmosphere. According to Svensmark, cosmic rays promote cloud formation. At any rate, they have to include all ocean temps at all depths to get an accurate heat content analysis of the biosphere. Right now the global warming zealots claim the missing heat is located deep down in the depths of the ocean.
Two small areas are found where a considerable temperature increase has occurred. They are explained in terms of major human interventions in the hydrological balance at the earth surface.
New York and Chicago had higher temps...
We’ve went from global warming to climate change. Gore’s next buzz word is Dirty Weather. It’s caused by dirty energy of course.
Disclaimer: Opinions posted on Free Republic are those of the individual posters and do not necessarily represent the opinion of Free Republic or its management. All materials posted herein are protected by copyright law and the exemption for fair use of copyrighted works.