Reference time frame is another thing ‘wrong’ with the chart. Liberal pundits have advanced the idea that Obama has held spending ‘steady’ whilst Republicans like Bush (and even Reagan) allowed spending to creep upward during their tenure. And this is ‘true’ because the stimulus and Obama’s Federal government expansion all occurred during his first year.
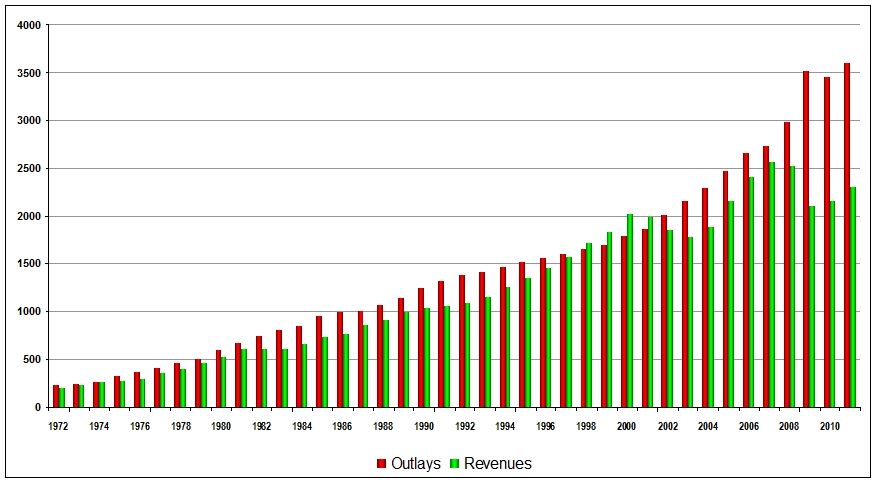
The following numbers come from the Congressional Budget Office:
.......Revenues........Outlays..........Surplus/Deficit
1972... 207.3.. ...... 230.7.. ..... -26.1
1973... 230.8.. ...... 245.7.. ..... -15.2
1974... 263.2.. ...... 269.4.. ..... -7.2
1975... 279.1.. ...... 332.3.. ..... -54.1
1976... 298.1.. ...... 371.8.. ..... -69.4
1977... 355.6.. ...... 409.2.. ..... -49.9
1978... 399.6.. ...... 458.7.. ..... -55.4
1979... 463.3.. ...... 504.0.. ..... -39.6
1980... 517.1.. ...... 590.9.. ..... -73.1
1981... 599.3.. ...... 678.2.. ..... -73.9
1982... 617.8.. ...... 745.7.. ..... -120.6
1983... 600.6.. ...... 808.4.. ..... -207.7
1984... 666.4.. ...... 851.8.. ..... -185.3
1985... 734.0.. ...... 946.3.. ..... -221.5
1986... 769.2.. ...... 990.4.. ..... -237.9
1987... 854.3.. ...... 1,004.0....... -168.4
1988... 909.2.. ...... 1,064.4....... -192.3
1989... 991.1.. ...... 1,143.7....... -205.4
1990... 1,032.0....... 1,253.0....... -277.6
1991... 1,055.0....... 1,324.2....... -321.4
1992... 1,091.2....... 1,381.5....... -340.4
1993... 1,154.3....... 1,409.4....... -300.4
1994... 1,258.6....... 1,461.8....... -258.8
1995... 1,351.8....... 1,515.7....... -226.4
1996... 1,453.1....... 1,560.5....... -174.0
1997... 1,579.2....... 1,601.1....... -103.2
1998... 1,721.7....... 1,652.5....... -29.9
1999... 1,827.5 ...... 1,701.8....... 1.9
2000... 2,025.2 ...... 1,789.0....... 86.4
2001... 1,991.1 ...... 1,862.8....... -32.4
2002... 1,853.1 ...... 2,010.9....... -317.4
2003... 1,782.3....... 2,159.9....... -538.4
2004... 1,880.1....... 2,292.8....... -568.0
2005... 2,153.6....... 2,472.0....... -493.6
2006... 2,406.9....... 2,655.1....... -434.5
2007... 2,568.0....... 2,728.7....... -342.2
2008... 2,524.0....... 2,982.5....... -641.8
2009... 2,105.0....... 3,517.7....... -1,549.7
2010... 2,162.7....... 3,456.2....... -1,370.5
2011... 2,302.5....... 3,598.1....... -1,362.8
As you can see, spending went steadily up under Bush, increased by $500 Billion during Obama’s first year. Another way to look at this is that no President other than Obama has ever run a $3 Trillion ‘budget’, and no President other than Obama has ever run a $Trillion deficit.
One other thing worth noticing is that Revenues went dramatically UP after the Bush tax cuts. Oops!
http://www.cbo.gov/publication/42911