Skip to comments.
BLS 8.3%- Gallup 9.1%- Obama 0%
Townhall.com ^
| March 10, 2012
| Mike Shedlock
Posted on 03/10/2012 5:28:41 AM PST by Kaslin
Quick Notes About the Unemployment Rate
- In the last year, the civilian population rose by 3,584,000. Yet the labor force only rose by 1,569,000. Those not in the labor force rose by 2,014,000.
- In February, the Civilian Labor Force rose by 476,000.
- In February, those "Not in Labor Force" decreased by 310,000. If you are not in the labor force, you are not counted as unemployed.
- Participation Rate rose .2 to 63.9%
- Were it not for people dropping out of the labor force, the unemployment rate would be well over 11%.
Over the past several years people have dropped out of the labor force at an astounding, almost unbelievable rate, holding the unemployment rate artificially low. Some of this was due to major revisions last month on account of the 2010 census finally factored in. However, most of it is simply economic weakness.
Jobs Report at a Glance
Here is an overview of today's release.
- US Payrolls +227,000 - Establishment Survey
- US Unemployment Rate steady at 8.3% - Household Survey
- Average workweek for all employees on private nonfarm payrolls was unchanged to 34.5 hours
- The average workweek for production and nonsupervisory employees on private nonfarm payrolls edged higher 0.1 hour to 33.8 hours.
- Average hourly earnings for all employees in the private sector rose by 3 cents to $23.31
Recall that the unemployment rate varies in accordance with the Household Survey not the reported headline jobs number, and not in accordance with the weekly claims data.
February 2012 Jobs Report
Please consider the Bureau of Labor Statistics (BLS) February 2012 Employment Report.
Nonfarm payroll employment rose by 227,000 in February, and the unemployment rate was unchanged at 8.3 percent, the U.S. Bureau of Labor Statistics reported today. Employment rose in professional and businesses services, health care and social assistance, leisure and hospitality, manufacturing, and mining.
Unemployment Rate - Seasonally Adjusted

Nonfarm Employment - Payroll Survey - Annual Look - Seasonally Adjusted

Actual employment is about where it was in 2001.
Nonfarm Employment - Payroll Survey - Monthly Look - Seasonally Adjusted

click on chart for sharper image
Between January 2008 and February 2010, the U.S. economy lost 8.8 million jobs.
Over the last two years, nonfarm payrolls have added 3.5 million jobs. Of the 8.8 million net jobs lost between January 2008 and February 2010, 40 percent have been recovered.
Statistically, 127,000 jobs a month is enough to keep the unemployment rate flat. The average employment gain over the last two years has been 145,000, barely enough (statistically speaking) to make a dent in the unemployment rate.
Yet, the civilian unemployment rate has dropped from 9.8% to 8.3%.

Average Weekly Hours

Index of Aggregate Weekly Hours

Average Hourly Earnings vs. CPI

"Success" of QE2 and Operation Twist
- Over the prior 12 months, average hourly earnings have increased by 1.9 percent. In January, the Consumer Price Index for All Urban Consumers (CPI-U) had an over-the-year increase of 2.9 percent; growth in prices has recently been outpacing growth in earnings.
- Not only are wages rising slower than the CPI, there is also a concern as to how those wage gains are distributed.
BLS Birth-Death Model Black Box
The BLS Birth/Death Model is an estimation by the BLS as to how many jobs the economy created that were not picked up in the payroll survey.
The Birth-Death numbers are not seasonally adjusted while the reported headline number is. In the black box the BLS combines the two coming out with a total.
The Birth Death number influences the overall totals, but the math is not as simple as it appears. Moreover, the effect is nowhere near as big as it might logically appear at first glance.
Do not add or subtract the Birth-Death numbers from the reported headline totals. It does not work that way.
Birth/Death assumptions are supposedly made according to estimates of where the BLS thinks we are in the economic cycle. Theory is one thing. Practice is clearly another as noted by numerous recent revisions.
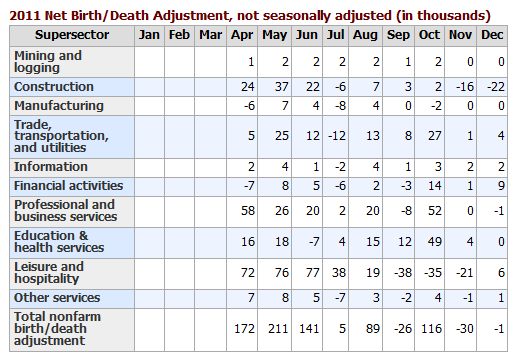
Birth Death Model Adjustments For 2011

Birth Death Model Adjustments For 2012

Birth-Death Note
Once again: Do NOT subtract the Birth-Death number from the reported headline number. That approach is statistically invalid.
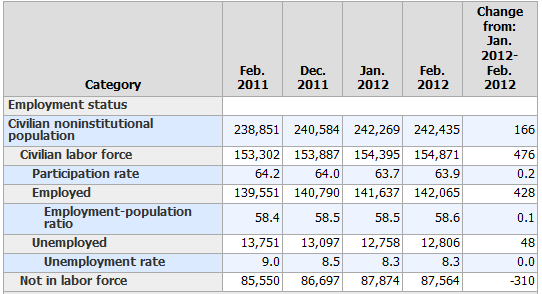
Household Survey Data

click on chart for sharper image
In the last year, the civilian population rose by 3,584,000. Yet the labor force only rose by 1,569,000. Those not in the labor force rose by 2,014,000.
That is an amazing "achievement" to say the least, and as noted above most of this is due to economic weakness not census changes.
Decline in Labor Force Factors
- Discouraged workers stop looking for jobs
- People retire because they cannot find jobs
- People go back to school hoping it will improve their chances of getting a job
- People stay in school longer because they cannot find a job
Were it not for people dropping out of the labor force, the unemployment rate would be well over 11%.
Part Time Status

click on chart for sharper image
Part-time status shows little improvement vs. a year ago.
Table A-15

click on chart for sharper image
Table A-15 is where one can find a better approximation of what the unemployment rate really is.
Notice I said "better" approximation not to be confused with "good" approximation.
The official unemployment rate is 8.3%. However, if you start counting all the people that want a job but gave up, all the people with part-time jobs that want a full-time job, all the people who dropped off the unemployment rolls because their unemployment benefits ran out, etc., you get a closer picture of what the unemployment rate is. That number is in the last row labeled U-6.
U-6 is much higher at 14.9%. Both numbers would be way higher still, were it not for millions dropping out of the labor force over the past few years.
Grossly Distorted Statistics
Given the complete distortions of reality with respect to not counting people who allegedly dropped out of the work force, it is easy to misrepresent the headline numbers.
Digging under the surface, the drop in the unemployment rate over the past two years is nothing but a statistical mirage. Things are much worse than the reported numbers indicate.
BLS vs. Gallup
Gallup has the unemployment rate at 9.1% not 8.3% and the "underemployment" number at 19.1%, not 14.9%.
Bear in mind the Gallup numbers are not seasonally adjusted but the BLS numbers reported above are. Nonetheless, it's entirely safe to say that 19.1% is far closer to the truth than 14.9%.
Please see Gallup Reports Large Jump in Unemployment to 9.1%, Underemployment to 19.1% for details.
TOPICS: Business/Economy; Culture/Society; Editorial; Politics/Elections
KEYWORDS: charts; labor; unemployment
1
posted on
03/10/2012 5:28:43 AM PST
by
Kaslin
To: Kaslin
Thanks for posting, there’s a lot of good information here.
2
posted on
03/10/2012 5:56:21 AM PST
by
khelus
To: Kaslin
To: khelus
Thanks for posting, there’s a lot of good information here. If the information came from the govt. I don't believe it.
I don't need charts, graphs and statistics. I can get all the information about unemployment by asking my friends and neighbors. And it's way worse than what the media and our so called leaders say.
4
posted on
03/10/2012 6:42:30 AM PST
by
unixfox
(Abolish Slavery, Repeal The 16th Amendment!)
To: Kaslin
Powerful stuff! Unfortunately, you gotta have two things to absorb it... an attentive brain, and “want-to”. That excludes about 99.9% of voters.
5
posted on
03/10/2012 6:46:24 AM PST
by
Lando Lincoln
(But that's just me.)
To: Kaslin
BTW... thanks for posting!
6
posted on
03/10/2012 6:47:12 AM PST
by
Lando Lincoln
(But that's just me.)
To: Kaslin
Obama has created millions of jobs in China.
7
posted on
03/10/2012 6:48:21 AM PST
by
rurgan
(Make all laws have an expiration date of 3 years. too many laws is the problem)
To: Kaslin
Just like Carter, this unrepentant Rat left a mess for the rest to clean up.
8
posted on
03/10/2012 6:48:50 AM PST
by
mountainlion
(I am voting for Sarah after getting screwed again by the DC Thugs.)
To: Kaslin
The Obama Programs are not working? We are in debt so deep we will never get out.
9
posted on
03/10/2012 6:53:37 AM PST
by
FreedBird
To: Kaslin
I wonder how immigration figures into these statistics. Are they included in the Birth/Death models? 1.2 million permanent LEGAL immigrants enter annually along with about 500,000 illegals.
We bring in 125,000 LEGAL foreign workers a month now thru temporary work visas and permanent immigrants.
10
posted on
03/10/2012 7:07:40 AM PST
by
kabar
To: kabar
I wonder how immigration figures into these statistics. Are they included in the Birth/Death models? 1.2 million permanent LEGAL immigrants enter annually along with about 500,000 illegals.
We bring in 125,000 LEGAL foreign workers a month now thru temporary work visas and permanent immigrants.
There are two sets of BLS employment stats: the Household Survey of individuals and the Payroll Survey of businesses.
Immigrants and illegal aliens would be included in the Household Survey statistics which are used to generate the unemployment rate. While the BLS survey asks if one is foreign born, it does not address legal status. There are categories that break out the numbers of the foreign born.
The Birth and Death model is a statistic model of the jobs created as the result of unreported businesses opened and closed. The results are applied to the Payroll Survey. It would have no reference point to where the job holders were born.
11
posted on
03/10/2012 7:21:44 AM PST
by
khelus
To: kabar
12
posted on
03/10/2012 7:30:26 AM PST
by
khelus
To: khelus
Thanks. We will add 130 million people to our population over the next 40 years, 75% due to immigration. By 2050, we will be a nation of 440 million. One in five will be foreign born.
13
posted on
03/10/2012 7:32:31 AM PST
by
kabar
To: rurgan
Obama has created millions of jobs in China.
and India. ... as did his predecessors.
14
posted on
03/10/2012 7:33:17 AM PST
by
khelus
To: khelus
Yeah but U.S. global competitiveness was at #1 when Obama took office now it’s at #5.
15
posted on
03/12/2012 4:56:59 AM PDT
by
rurgan
(Make all laws have an expiration date of 3 years. too many laws is the problem)
Disclaimer:
Opinions posted on Free Republic are those of the individual
posters and do not necessarily represent the opinion of Free Republic or its
management. All materials posted herein are protected by copyright law and the
exemption for fair use of copyrighted works.
FreeRepublic.com is powered by software copyright 2000-2008 John Robinson