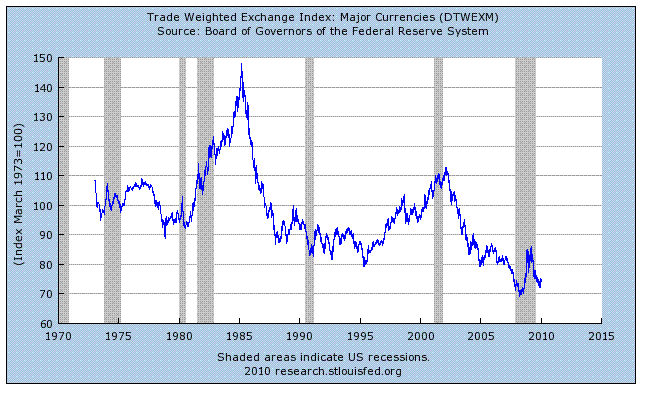
Seems we got a lot of people interested in convincing me that a weak dollar increases exports. OK people, first you'll need to show me how the exchange rates go up and down---

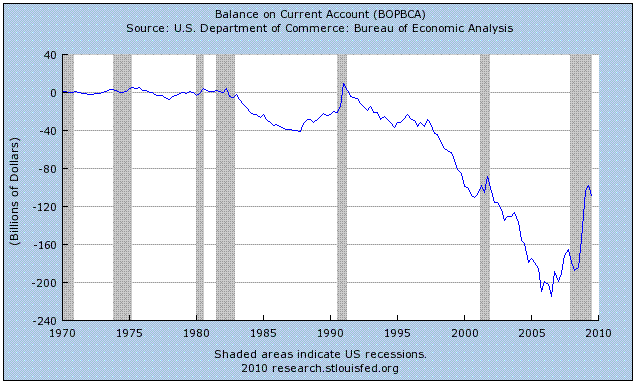
--and then explain why the trade balance goes up and down in a way that has nothing to do with exchange rates--

--and when you check it year by year the two are together half the time and go separate ways the other half.
| trade deficit | dollar exchange rate | trade | dollar | correlation | ||
| 1973 | 0.14% | 108.19 | ||||
| 1974 | -0.29% | 105.84 | down | down | direct | |
| 1975 | 0.76% | 100.42 | up | down | inverse | |
| 1976 | -0.33% | 105.62 | down | up | inverse | |
| 1977 | -1.34% | 107.12 | down | up | inverse | |
| 1978 | -1.30% | 101.14 | up | down | inverse | |
| 1979 | -0.96% | 94.46 | up | down | inverse | |
| 1980 | -0.70% | 95.07 | up | up | direct | |
| 1981 | -0.52% | 96.03 | up | up | direct | |
| 1982 | -0.74% | 107.14 | down | up | inverse | |
| 1983 | -1.63% | 115.69 | down | up | inverse | |
| 1984 | -2.77% | 125.36 | down | up | inverse | |
| 1985 | -2.89% | 138.97 | down | up | inverse | |
| 1986 | -3.10% | 120.19 | down | down | direct | |
| 1987 | -3.20% | 101.85 | down | down | direct | |
| 1988 | -2.24% | 89.62 | up | down | inverse | |
| 1989 | -1.70% | 90.55 | up | up | direct | |
| 1990 | -1.39% | 92.41 | up | up | direct | |
| 1991 | -0.52% | 85.01 | up | down | inverse | |
| 1992 | -0.62% | 85.61 | down | up | inverse | |
| 1993 | -1.06% | 91.5 | down | up | inverse | |
| 1994 | -1.39% | 92.01 | down | up | inverse | |
| 1995 | -1.30% | 87.07 | up | down | inverse | |
| 1996 | -1.33% | 86.45 | down | down | direct | |
| 1997 | -1.30% | 90.04 | up | up | direct | |
| 1998 | -1.88% | 98.49 | down | up | inverse | |
| 1999 | -2.84% | 94.48 | down | down | direct | |
| 2000 | -3.85% | 96.06 | down | up | inverse | |
| 2001 | -3.58% | 103.51 | up | up | direct | |
| 2002 | -4.02% | 111.21 | down | up | inverse | |
| 2003 | -4.52% | 98.77 | down | down | direct | |
| 2004 | -5.23% | 84.38 | down | down | direct | |
| 2005 | -5.77% | 81.05 | down | down | direct | |
| 2006 | -5.48% | 84.44 | up | up | direct | |
| 2007 | -4.84% | 82.37 | up | down | inverse |
Seriously, when I first learned about this it seemed impossible, but when I checked just how cross border trade worked it made perfect sense. Let me know if anyone's interested in what I found out.