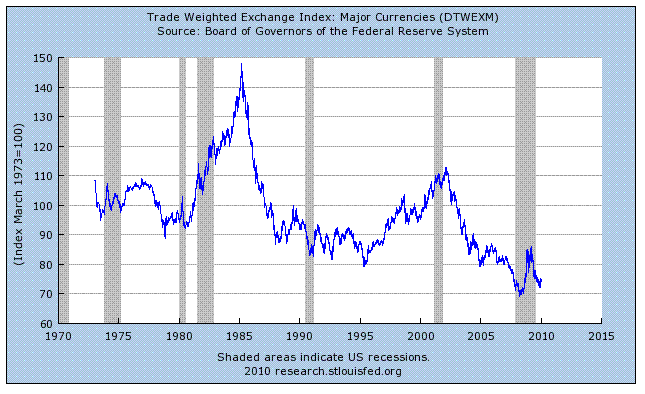
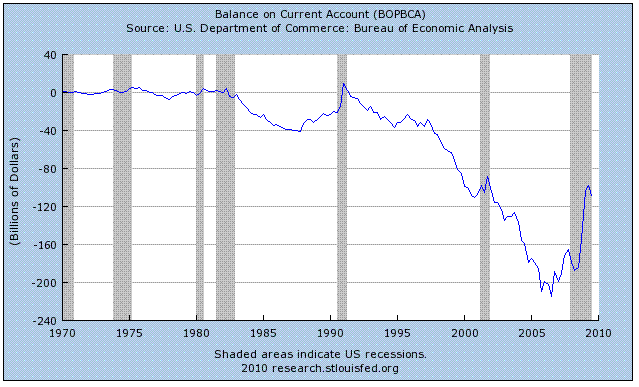
Of course they do! Seems we got a lot of people interested in convincing me that a weak dollar increases exports. OK people, first you'll need to show me how the exchange rates go up and down---

--and then explain why the trade balance goes up and down in a way that has nothing to do with exchange rates--

--and when you check it year by year the two are together half the time and go separate ways the other half.
| |
|
trade deficit |
dollar exchange rate |
trade |
dollar |
correlation |
| 1973 |
|
0.14% |
108.19 |
|
|
|
| 1974 |
|
-0.29% |
105.84 |
down |
down |
direct |
| 1975 |
|
0.76% |
100.42 |
up |
down |
inverse |
| 1976 |
|
-0.33% |
105.62 |
down |
up |
inverse |
| 1977 |
|
-1.34% |
107.12 |
down |
up |
inverse |
| 1978 |
|
-1.30% |
101.14 |
up |
down |
inverse |
| 1979 |
|
-0.96% |
94.46 |
up |
down |
inverse |
| 1980 |
|
-0.70% |
95.07 |
up |
up |
direct |
| 1981 |
|
-0.52% |
96.03 |
up |
up |
direct |
| 1982 |
|
-0.74% |
107.14 |
down |
up |
inverse |
| 1983 |
|
-1.63% |
115.69 |
down |
up |
inverse |
| 1984 |
|
-2.77% |
125.36 |
down |
up |
inverse |
| 1985 |
|
-2.89% |
138.97 |
down |
up |
inverse |
| 1986 |
|
-3.10% |
120.19 |
down |
down |
direct |
| 1987 |
|
-3.20% |
101.85 |
down |
down |
direct |
| 1988 |
|
-2.24% |
89.62 |
up |
down |
inverse |
| 1989 |
|
-1.70% |
90.55 |
up |
up |
direct |
| 1990 |
|
-1.39% |
92.41 |
up |
up |
direct |
| 1991 |
|
-0.52% |
85.01 |
up |
down |
inverse |
| 1992 |
|
-0.62% |
85.61 |
down |
up |
inverse |
| 1993 |
|
-1.06% |
91.5 |
down |
up |
inverse |
| 1994 |
|
-1.39% |
92.01 |
down |
up |
inverse |
| 1995 |
|
-1.30% |
87.07 |
up |
down |
inverse |
| 1996 |
|
-1.33% |
86.45 |
down |
down |
direct |
| 1997 |
|
-1.30% |
90.04 |
up |
up |
direct |
| 1998 |
|
-1.88% |
98.49 |
down |
up |
inverse |
| 1999 |
|
-2.84% |
94.48 |
down |
down |
direct |
| 2000 |
|
-3.85% |
96.06 |
down |
up |
inverse |
| 2001 |
|
-3.58% |
103.51 |
up |
up |
direct |
| 2002 |
|
-4.02% |
111.21 |
down |
up |
inverse |
| 2003 |
|
-4.52% |
98.77 |
down |
down |
direct |
| 2004 |
|
-5.23% |
84.38 |
down |
down |
direct |
| 2005 |
|
-5.77% |
81.05 |
down |
down |
direct |
| 2006 |
|
-5.48% |
84.44 |
up |
up |
direct |
| 2007 |
|
-4.84% |
82.37 |
up |
down |
inverse |
Seriously, when I first learned about this it seemed impossible, but when I checked just how cross border trade worked it made perfect sense. Let me know if anyone's interested in what I found out.
"Expecting" weaker U.S. dollar to ease unemployment is like "expecting" Zimbabwe to have lower unemployment due to hyperinflation, so I don't even understand how someone could even come up with the premise... ah, I see it's from New York Times.
The problem with many people not understanding why the exchange rate / weak currency has little or no correlation with the current account / balance of trade is because they fail to take into account that weak currency in many cases also leads to increased cost of producing the goods (e.g., when the domestically manufactured goods rely on imported raw materials which become more expensive) so the overall competitiveness of the final products made for export may be little changed; but it would depend on the mix of goods and products that country's companies export, particularly in any given year. So the "competitively devalued" currency may help some industries / sectors / companies that don't rely on foreign raw supplies, while hurting other companies within other industries / sectors (usually finished goods manufacturing) suffers from increased domestic production costs. At best, currency devaluation is a net zero for the balance of trade, but is usually a drag / tax for the consumers.
This would also help explain why currencies of resource-rich-export-driven countries like Australia and Canada have held up better than USD$. Another example is how China can have high trade surplus (and high inflation) with their [ostensibly] devalued yuan / renminbi, while devalued USD$ didn't lead to either trade surpluses or high inflation. Basically, it's more related to the mix of import / export goods and products by country than a currency exchange.
The USD$ Cash Index is slightly higher now (~ 78) than it was at the end of 2007 (~ 76), and has been higher ever since the multi-decade bottom in March-July of 2008 (~ 72), and the peak was in June 2001-February 2001 (~ 120) ...
Crude Oil was about US$27 in January 2001, $20 in January 2002 (post-9/11) and peaked at US$145 in July 2008 (pre-crash).
Gold was around US$260 in early 2001, US$1030 in March 2008, and broke US$1400 in Novemebr 2010. Silver was about US$4.50 in early 2001, US$21 in March 2008, and broke US$29 in November 2010.
All without the "benefit" of TARP, QE, or QE2... The U.S. dollar has been "competitively devalued" starting with Bush administration (despite all his Treasury secretaries having to assure with a more-or-less straight face that they had a "policy of strong dollar") and this devaluation was well before and had nothing to do with TARP, QE1 or QE2... Don't know who on his economic team advised him on this. BTW, give Bob Rubin some due on this - when he was talking about having a "policy of strong dollar" he really meant it, and people knew it. Of course, the 1997-1998 "Asian flu" and Russian Ruble crises didn't hurt the USD$, either.
So, why all this hand-wringing about U.S. dollar "devalued due to QE2" now? Because the politicians found they can have a convenient boogieman and scapegoat - the Fed and QE2 - rather than having to explain their reckless fiscal policy of higher spending, deficits, and onerous regulations which make it very difficult for companies to expand, hire or start business in the U.S. when it's so much easier and more profitable to deploy capital where it's welcome and, for now, is well treated.

