
Posted on 12/13/2009 7:45:18 PM PST by nwrep
Many scientific reports have shown a strong correlation between sunspot activity and global mean temperatures. The most well-known such graph is the one plotted by Friis-Christensen and Lassen. A graph derived from similar observations is shown below:
GRAPH 1:Correlation between Sunspot activity and global temperatures
It is important to note that there are small periods of anomaly in this correlation, but that the behavior returns to one of strong correlation over extended periods of time.
GRAPH 1A: Correlation between Sunspot activity and global temperatures over 10,000 years (reconstructed)

As has been recently noted by several physicists, the solar activity levels in 2009 have shown several consecutive days without a spot, indicating that the sun is at a low point of a deep solar minimum. Sunspot activity reached a peak around the year 2000, and has dropped since then.
GRAPH 2: Sunspot activity observations plotted by year:

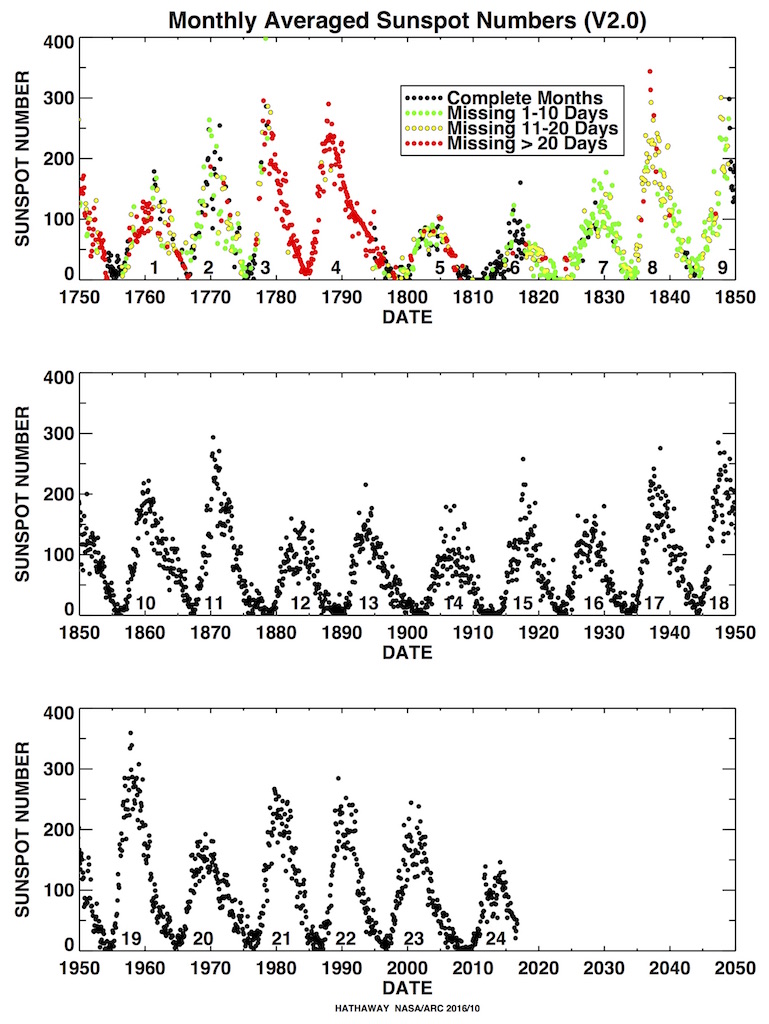
Here is another graph showing the same activity, plotted for 3 different centuries:
GRAPH 3: Monthly Average Sunspot activity by year, from NASA

Now, NASA scientists have created simulations to predict the solar activity over the next decade. According to the scientists at the Marshall Space Flight Center, where the simulations were carried out,
"Predicting the behavior of a sunspot cycle is fairly reliable once the cycle is well underway (about 3 years after the minimum in sunspot number occurs [see Hathaway, Wilson, and Reichmann Solar Physics; 151, 177 (1994)]). We have employed several methods to determine the size of the next sunspot cycle using a technique that weights the different predictions by their reliability. [See Hathaway, Wilson, and Reichmann J. Geophys. Res. 104, 22,375 (1999)] Our current analysis indicates a maximum sunspot number of about 78 ± 18 for cycle 24. We then use the shape of the sunspot cycle as described by Hathaway, Wilson, and Reichmann [Solar Physics 151, 177 (1994)] and determine a starting time for the cycle by fitting the data to produce a prediction of the monthly sunspot numbers through the next cycle. We find a starting time of March 2008 with minimum occurring in November or December 2008 and maximum in April or May 2013."
GRAPH 4:NASA Predictions of Solar Activity for the next decade

As seen from the picture, there is band of uncertainty associated with the prediction, but the average sunspot number predicted for the maxima of the next decade is around 75-80 (official prediction: 78 with an uncertainty of +/- 18).
From Graph 3 of the sunspot activity for the past 3 centuries, the last decade to show a maxima this low (significantly below 100) was 1880-1890. What the NASA prediction therefore tells us is that if the strong correlation between sunspot activity and global mean temperatures shown in Graphs 1 and 1A holds, the coming decade could be possibly the coldest decade in over a century, with temperatures not seen since the Victorian era.
The DUmmies have already blamed this cooling decade on global warming. Yes, like massive government spending will reduce the deficit, global warming will cool the earth.
It sounds logical to me. (Huh? WT....?)
Sorry, I won’t believe it until the Old Farmer’s Almanac confirms.
I saw the youtube video and thought it looked more like a seizure than a heart attack but a Pacemaker kicking in would explain that...
Here is an early thread on why this may not be true and the forecast should be revised down to zero sun spots.
http://www.freerepublic.com/focus/f-news/2400331/posts
Very true. I bought a book called the Gardeners Weather Bible. It teaches the tricks the old timers used to use to predict the weather. It's still on my "to learn" list, though. I really should get back to that book. I keep getting side tracked by other stuff.
GLOBAL WARMING OFFICALLY OVER says NASA! Time to move towards the equator everyone. All undocumented workers first.
The top dog at the IPCC has a religious belief that the SUN never changes. Some of the running dog lackeys over there are not beyond killing opponents to that thesis.
Nonsense! I distinctly remember during the summer, a Canadian astronaut in the space station remark how much less ice there was in the Arctic than when he was up there 10 years ago in the winter...
You’d think that sunspot data ought to be very accurate, certainly more accurate than the centuries of “average global temperatures” (based apparently for the most part of tree ring data from a few locations in the northern hemisphere), regardless of whether one claims that the temperature record shows a hockey-stick shaped surge to dangerous levels or a correlation to sunspot activity. I’m getting kind of sick and tired of statisticians pretending to be scientists when they have yet to come close to really understanding the science behind all this wonderful data.
10 years ago the cooling off cycle had just started, and the warming cycle was coming to an end. If true, the ice may have melted from the warning up cycle and now has to rebuild itself. A cycle usually last about 30 years. That's how the commies on the left got an entire generation thinking there was going to be an ice age. After that, a whole generation was led to believe the earth was going to burn up. Now, the commies have to go back to the death by ice age again.
“I’m getting kind of sick and tired of statisticians pretending to be scientists when they have yet to come close to really understanding the science behind all this wonderful data.”
I assume this was facetious??
Does anyone know with some certainty how much total energy from the sun is getting absorbed by the earth in terms of electromagnetic waves, subatomic particles, and other stuff (like effects of tidal forces perhaps ...?). Seem to remember reading somewhere that the W/m^2 of light radiation (very easy to measure) hasn’t really changed that much at all although it may have been higher/lower a very long time ago.
Now that the global warming scam has been blown wide open - they're trying to save their butts by reporting the truth?
You would enjoy my daughter’s facebook group, People’s Organization for the Preservation of the Earth or POPE. Their motto is (tongue firmly in cheek): Stop Global Warming, Extinguish the sun.
bump for later read
Hehe...Love it!!
Uhhh...in your first graph, the blue line is going up and the red line is going down. I don’t see how that proves we are headed for a decade of record low temps.
I don’t think so. Correlation between A and B doesn’t mean A causes B, and says even less about why and how A influences B. But after hearing about all the wonderful liberties that CRU “scientists” took with the raw data that were all too happy to shred instead of sharing with all the different kinds of researchers out there (particularly given how historic and consequential this research was supposed to be for all mankind), I really doubt whether much of this has anything to do with science. Going by the plots up above, I don’t see a correlation between temperature and sunspot activity either.
Heh...The effects of the sun should and are delayed a bit I would think. At any rate, you sound like a global warming enthusiast to me... Good luck with that, but maybe you should listen to Lord Monckton and his cerebral analysis before becoming a pervert (whoops, I mean convert)...
Disclaimer: Opinions posted on Free Republic are those of the individual posters and do not necessarily represent the opinion of Free Republic or its management. All materials posted herein are protected by copyright law and the exemption for fair use of copyrighted works.