Skip to comments.
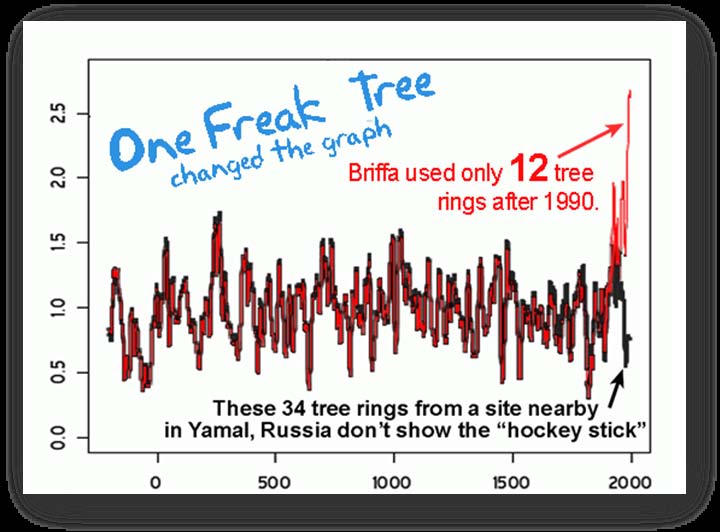
Broken Hockey Stick! (Global Warming Scam Busted)
Still Waiting for Warming ^
| Oct 29, 2003
| John Daly
Posted on 10/29/2003 10:15:44 AM PST by Dan Evans
click here to read article
Navigation: use the links below to view more comments.
first previous 1-20, 21-40, 41-60, 61-80, 81-84 next last
To: cogitator
Yes, CO2 was fairly stable through the MWP, although the ice cores for that period have a right-handed distribution (about a decade or so of substantial smoothing) as the ice sealed. So CO2 wasn't the driver then, no doubt about that. Your painstaking process of elimination doesn't measure all solar influences, natural aerosols, and the longer ocean cycles. The latter is not an either-or like you imply:
We do not have any evidence that the proposed primary driver of MWP warmth, ocean current variability, is a factor now
That is simply wrong, there is ample evidence that the PDO caused the current warming, see fig 3b here:
http://www.drroyspencer.com/research-articles/global-warming-as-a-natural-response/
You can easily cut and paste the usual rebuttal from RealClimate for this paper, but the fact remains that PDO was positive and PDO causes warmer arctic waters and more El Ninos. The worldwide effect can be argued, but warming is obviously in the running.
Alternatively you could argue for ocean acidification or reduced biodiversity and I've always conceded those. But direct climate effects from CO2 pale in comparison to natural variation.
61
posted on
12/16/2009 4:58:37 AM PST
by
palmer
(Cooperating with Obama = helping him extend the depression and implement socialism.)
To: palmer
Yes, CO2 was fairly stable through the MWP, although the ice cores for that period have a right-handed distribution (about a decade or so of substantial smoothing) as the ice sealed. So CO2 wasn't the driver then, no doubt about that. Your painstaking process of elimination doesn't measure all solar influences, natural aerosols, and the longer ocean cycles. The latter is not an either-or like you imply:We do not have any evidence that the proposed primary driver of MWP warmth, ocean current variability, is a factor now
First of all, ENSO and PDO are not the same as "ocean current variability" as related to the MWP, which appears to have been caused mainly by changes in the rate of transport of the thermohaline circulation. ENSO and PDO are changes in the surface currents and gyres, wind-driven (or lack-of-wind-driven). Heat transport in El Nino events is via Kelvin Waves; not the same as a thermohaline circulation.
That is simply wrong, there is ample evidence that the PDO caused the current warming, see fig 3b here: http://www.drroyspencer.com/research-articles/global-warming-as-a-natural-response/
Spencer... let me get my references...
You can easily cut and paste the usual rebuttal from RealClimate for this paper, but the fact remains that PDO was positive and PDO causes warmer arctic waters and more El Ninos. The worldwide effect can be argued, but warming is obviously in the running.
Did RealClimate do anything on this? (OK, I found RayPierre's article) Anyway, here's a different rebuttal:
Is the Pacific Decadal Oscillation the Smoking Gun?
Now, from Spencer's own article:
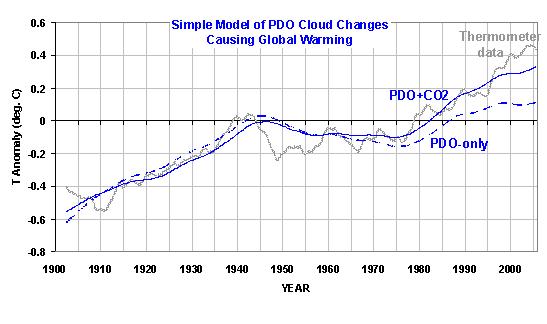
"The “PDO-only” (dashed) curve in Fig. 4 indeed mimics the main features of the behavior of global mean temperatures during the 20th Century — including three-quarters of the warming trend. If I include the CO2 and other forcings during the 20th Century complied by James Hansen with the PDO-forced cloud changes (solid line labeled PDO+CO2), then the fit to observed temperatures is even closer."
Indeed. Let me rephrase. "Starting about 1975, there's a divergence between the PDO-only curve and actual global temperatures. This occurred about the same time that anthropogenic sulfur aerosols were being reduced, which had previously inhibited the warming attributable to increasing atmospheric CO2 and concomitant atmospheric water vapor. Proceeding into the late 20th and early 21st century, the fit with my model becomes increasingly poor, but if I add the forcing attributable to CO2, precisely where most climate scientists predicted that the CO2-driven warming signal would begin to emerge from the "noise" of natural climate variability, the fit is actually acceptable. Thus, it is clear that CO2 has been a significant driver of the late 20th century warming trend, and given its increasing atmospheric concentrations, would be expected to become an even more dominant factor in the future."
Amazing what a little perspective does for you, isn't it?
And while we're at it, should we be setting global temperature records during a cold-phase PDO? Should we be having years that are in the top 5 warmest ever? That'd be a good question for Dr. Roy.
He's already provided a partial answer:
"If the PDO has recently entered into a new, negative phase, then we can expect that global average temperatures, which haven’t risen for at least seven years now, could actually start to fall in the coming years."
The current El Nino is making things real interesting. Of course, I think it will fall apart by next March and further muddy the waters by only making 2010 the third-warmest year of all time. But a guy can hope. I really don't want the world to get any warmer, but to prove a point...
Spencer is nibbling on the edges of significance; if he makes a big enough deal, I'd expect a response in the peer-reviewed lit. Eventually.
Alternatively you could argue for ocean acidification or reduced biodiversity and I've always conceded those. But direct climate effects from CO2 pale in comparison to natural variation.
I'd rather argue against them. I.e., they're bad things.
[FYI: NASA Outlines Recent Breakthroughs in Greenhouse Gas Research Read what Dessler says.]
To: cogitator
The current El Nino is making things real interesting. Of course, I think it will fall apart by next March and further muddy the waters by only making 2010 the third-warmest year of all time. But a guy can hope. I really don't want the world to get any warmer, but to prove a point... And win your bet. You are on the record here as saying that the next large El Nino would exceed 1998 measured by satellite (don't have the link, I'll have to dig it up). But let's go back to earlier in the thread where you said:
Multiple lines of evidence support that ocean circulation was the main driver. We do not have a similar situation now.
If PDO is not the main driver, then why is it getting cooler now that PDO has switched to negative? The correlation is nearly perfect, positive PDO from 77 to 98, and trending negative since then.
63
posted on
12/17/2009 3:01:04 AM PST
by
palmer
(Cooperating with Obama = helping him extend the depression and implement socialism.)
To: palmer
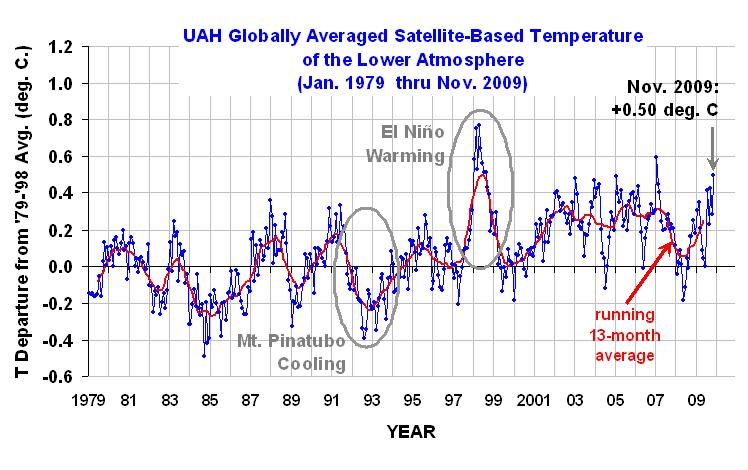
Here's UAH MSU for the record, we're waiting for 0.8 and you still have almost 4 years left.
64
posted on
12/17/2009 3:14:33 AM PST
by
palmer
(Cooperating with Obama = helping him extend the depression and implement socialism.)
To: palmer
The current El Nino is making things real interesting. Of course, I think it will fall apart by next March and further muddy the waters by only making 2010 the third-warmest year of all time. But a guy can hope. I really don't want the world to get any warmer, but to prove a point...And win your bet.
I know, I've only got until 2013.
You are on the record here as saying that the next large El Nino would exceed 1998 measured by satellite (don't have the link, I'll have to dig it up).
Actually, no, I've said the next year with a moderate-to-large El Nino would make that year the record-breaker in all three surface indices (NOAA, GISS, Hadley CRU). Hadley CRU may not be available for awhile. This El Nino is in the minor-to-moderate range. I think I told Wonder Warthog that if April 2009 - March 2010 could be analyzed, I would expect that 12-month period to be warmer than any other 12-month period in the entire instrumental record. But the El Nino effects could get split between two calendar years, and thus my pessimism if the current episode fades early in 2010.
But let's go back to earlier in the thread where you said:
Multiple lines of evidence support that ocean circulation was the main driver. We do not have a similar situation now.
If PDO is not the main driver, then why is it getting cooler now that PDO has switched to negative? The correlation is nearly perfect, positive PDO from 77 to 98, and trending negative since then.
Several factors.
1) Erroneous perception of "cooler". 2005 was just barely under 1998 by Hadley and NOAA (with no El Nino*); GISS had it warmer. 1/10 of a degree higher in 2005, and there'd be none of this ridiculous talk of a 10-year cooling trend.
2) Reduced solar irradiance during an extended solar minimum.
3) Fairly strong La Nina starting in 2007 (ASO) extending to 2008 (AMJ); because of lag effects, 2008 was cooler than 2007. Very, very critical: though the La Nina episode officially ended in AMJ 2008, La Nina conditions (ONI in Nino 3.4) re-emerged through MAM 2009. ONI was never above 0 from MAM 2007 to MAM 2009. That's a long cool stretch. And that could have been related to the negative PDO. Lean and Rind (below) don't say anything about the PDO. If we're still in a negative PDO phase now, then this El Nino is bucking the influence.
Support:
How will Earth’s surface temperature change in future decades?
* You know, I just noticed something. Lag time is important. There was a minor El Nino episode in 2004 (ONI in El Nino 3.4 never got over 0.9). But it was nine 3-month periods long (with ONI positive for a bit longer). It was the remnant warming from this minor El Nino, superposed on the general warming trend, that allowed 2005 to get close to 1998.
TWT.
To: cogitator
what surface record? I read the “raw data” thread at RC and saw very little actual raw data except for Europe (they misdirect as usual). You are not getting off the hook that easily, we will use satellite.
66
posted on
12/18/2009 2:53:28 AM PST
by
palmer
(Cooperating with Obama = helping him extend the depression and implement socialism.)
To: cogitator
none of this ridiculous talk of a 10-year cooling trend. Just glanced at post 64. I don't believe I have ever hyped the 98 El Nino as part of any trend, it is an outlier. The short term trend is basically flat.
67
posted on
12/18/2009 2:56:38 AM PST
by
palmer
(Cooperating with Obama = helping him extend the depression and implement socialism.)
To: palmer
what surface record? I read the “raw data” thread at RC and saw very little actual raw data except for Europe (they misdirect as usual). You are not getting off the hook that easily, we will use satellite.The bet was about the surface temperature records. I've stated it many times. I did the calculation (in my profile) considering a 0.2 degree C per decade trend, and that's the surface trend. I never considered the LT trend(s). (I thought there were three, too, but right now I can only think of UAH and RSS. There was Vinnikov and Grody; maybe that's what I was thinking of.)
One example:
http://www.freerepublic.com/focus/news/1958442/posts?page=193 (post 154)
and
http://209.157.64.201/focus/f-news/1963363/replies?c=85
kidd wanted it to be about the satellite temperature record, too. But that was never how I stated it. I will, of course, be curious as to how the LT temperatures behave. But they might be even more sensitive to a strong El Nino due to increased convection over a broader area of the Pacific; hence, a bigger El Nino like 1998 might have a disproportionate effect on the LT, rather than a more general surface warming. That's just speculation. But it doesn't change the terms of my "bet".
To: palmer
I don't believe I have ever hyped the 98 El Nino as part of any trend, it is an outlier. The short term trend is basically flat. You might not have, but 9/10s of the skeptical world does. As for short-term, how can you look at the graph and see the difference between the '90s and the '00s (disregarding the 1998 spike) and say it's "flat"? Your short-term is pretty short.
To: cogitator
My short term is the 00’s. It might be “pretty short” but it’s still a fact. The solar influences may play a role in that, but it mostly seems to be PDO. The comparison of the 90’s and 00’s mainly proves my point about PDO.
70
posted on
12/19/2009 12:41:29 AM PST
by
palmer
(Cooperating with Obama = helping him extend the depression and implement socialism.)
To: cogitator
So you think LT measurements from satellites are no good. Ok, explain why you want to use surface records which use one single station next to a plowed runway on the warm antarctic peninsula to represent the whole continent instead of many satellite measurements taken around the continent and extrapolated into the interior. When you are done answering that I have more questions.
71
posted on
12/19/2009 1:01:01 AM PST
by
palmer
(Cooperating with Obama = helping him extend the depression and implement socialism.)
To: Dan Evans
72
posted on
12/19/2009 1:12:18 AM PST
by
airborne
(HAPPY BIRTHDAY JESUS !!!!!!!!!)
To: palmer
So you think LT measurements from satellites are no good. Ok, explain why you want to use surface records which use one single station next to a plowed runway on the warm antarctic peninsula to represent the whole continent instead of many satellite measurements taken around the continent and extrapolated into the interior. When you are done answering that I have more questions.I never said that satellite LT measurements are no good. I have simply stated my bet (against myself) in terms of the surface record(s), which have exhibited a 0.2 C per decade trend. Remember that this is global ocean+land, and that ocean is 70% of the surface. Thus, I'm not surprised that most of the Antarctic warming is on the peninsula, because that's the area most heavily influenced by the Southern Ocean -- which is warming. Furthermore, the Antarctic interior (unlike the Arctic) is warming very little. So it's a very minor part of the trend upon which I formulated my bet.
I'm aware of the argumentation regarding surface station siting, how much or how little influence this may have on the trends. I don't want to discuss that. The records are what they are; influenced by climate warming, UHI, ENSO, deforestation, whatever, they have a roughly 0.2 C per decade warming trend. I feel that they indicate, fairly accurately, climatic trends. This engendered my question to OldProfesser:
"1) If the surface temperature record is SO bad due to loss of thermometers or siting problems, then why do skeptics think it's good enough to show global cooling over the past decade?
2) If the record is SO bad, then why does it show, consistently, the effects of major El Nino and La Nina episodes? (I even had to fix the missing image in my profile, point #4, for this!)"
To which I'll add now:
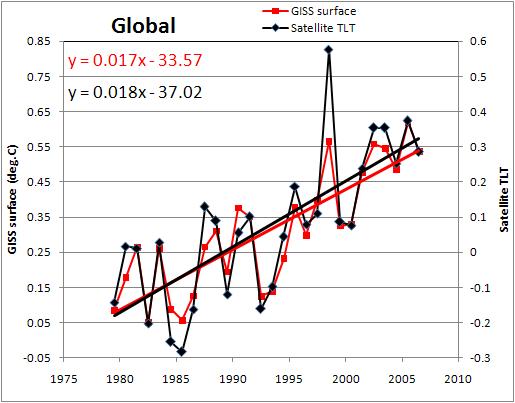
How incongruent is the shape of the surface station record for the period 1979-present with the LT temperature records over the same span?
I.e., do you believe this graph?
To: palmer
74
posted on
12/22/2009 9:58:02 PM PST
by
jwalsh07
To: cogitator
do you believe this graph? What I believe is of no consequence. If you want to know if that graph is correct, then no, it is not. See my post above particularly the 13 month smoothing which is probably the best way to compare to GISS (I have no similarly smoothed chart for GISS).
The surface record is not bad showing short term fluctuations corresponding to El Nino. The problem is mostly the incongruous adjustments made to allegedly compensate for missing data, discontinuities and UHIE, but result in a downward bias early last century, see RomanM's blog for details (http://statpad.wordpress.com/2009/12/12/ghcn-and-adjustment-trends/). Distribution of adjustments:

75
posted on
12/23/2009 5:18:32 AM PST
by
palmer
(Cooperating with Obama = helping him extend the depression and implement socialism.)
To: palmer
What I believe is of no consequence. If you want to know if that graph is correct, then no, it is not. See my post above particularly the 13 month smoothing which is probably the best way to compare to GISS (I have no similarly smoothed chart for GISS).Explain why it's not correct. You're asking why I didn't bet on the LT trends; because the surface station record is inaccurate. The graph shows that the trends and peaks and valleys are virtually identical. I look at the graph in post 64, and though an overlain comparison isn't possible, the same features are evident. So whysit so bad?
Regarding the RomanM adjustments, he's banging heads with another blogger, gg (for Giorgio Gilestro):
Lots of smoke, hardly any gun. Do climatologists falsify data?
I don't think this has reached anywhere close to a resolution yet, but I am impressed with the sophistication level of some of these analyses (and the speed that they're being done). Are all these guys on "The Big Bang Theory"?
Bottom line: I don't see sufficient discrepancies with either the event correlations (i.e., El Ninos, La Ninas, and volcanic eruptons) or the LT record to question the validity of the surface station records with regard to their determination of a new surface temperature record. I note again that you brought up the land data, and as I noted, the global land+ocean record is 70% (or so) ocean.
To: cogitator
Regarding the RomanM adjustments, he's banging heads with another blogger, gg (for Giorgio Gilestro): You are off by one bang. The graph I posted above was a reply to Giorgio's post. Here's the RomanM thread with Giorgio's misleading Gaussian graph and how it was derived http://statpad.wordpress.com/2009/12/12/ghcn-and-adjustment-trends/ If you find a reply to RomanM's post, I would like to read it.
If the surface station record is inaccurate over LT (at least I think that's what you said), then why are you using it to bet on 1998 versus 201X El Nino peaks? Isn't that going to be affected by the adjustments also? As you can see from the graph I posted from RomanM, recent adjustments are all over the map and are presumably responsible for the 2005 "record" in the surface temp exceeding 1998.
Do you really believe that from 2004 to 2005 the surface record contained enough discontinuities, etc that it needed to be adjusted upwards by 0.1C?
77
posted on
12/25/2009 5:58:53 AM PST
by
palmer
(Cooperating with Obama = helping him extend the depression and implement socialism.)
To: cogitator
Regarding the RomanM adjustments, he's banging heads with another blogger, gg (for Giorgio Gilestro): You are off by one bang. The graph I posted above was a reply to Giorgio's post. Here's the RomanM thread with Giorgio's misleading Gaussian graph and how it was derived http://statpad.wordpress.com/2009/12/12/ghcn-and-adjustment-trends/ If you find a reply to RomanM's post, I would like to read it.
If the surface station record is inaccurate over LT (at least I think that's what you said), then why are you using it to bet on 1998 versus 201X El Nino peaks? Isn't that going to be affected by the adjustments also? As you can see from the graph I posted from RomanM, recent adjustments are all over the map and are presumably responsible for the 2005 "record" in the surface temp exceeding 1998.
Do you really believe that from 2004 to 2005 the surface record contained enough discontinuities, etc that it needed to be adjusted upwards by 0.1C?
78
posted on
12/25/2009 5:58:54 AM PST
by
palmer
(Cooperating with Obama = helping him extend the depression and implement socialism.)
To: palmer
If you find a reply to RomanM's post, I would like to read it.It was a series of interesting parallel threads; I didn't sense a resolution.
If the surface station record is inaccurate over LT (at least I think that's what you said),
The graph I posted in #73 indicated to me that they're showing the same behaviors; i.e., if one is accurate, so's the other one (and vice versa, naturally).
then why are you using it to bet on 1998 versus 201X El Nino peaks? Isn't that going to be affected by the adjustments also?
To put it simply, there's good adjustments and bad adjustments. Good adjustments are necessary to fix recognized systematic sampling errors/biases. Bad adjustments would be unnecessary, and also (perhaps) done to fix a perceived but unestablished bias. So I don't know if I'm answering the question you asked or not when I say: both surface and LT temperature records are affected by adjustments. I formulated the bet based on the reported trend in the surface temperature record.
Counter-question: is all of this about land surface stations? What about ocean temperatures?
As you can see from the graph I posted from RomanM, recent adjustments are all over the map and are presumably responsible for the 2005 "record" in the surface temp exceeding 1998.
I presume nothing; I need a clearer statement than that. As for 2005 vs. 1998, NOAA did not report 2005 > 1998. Only GISS did (and they said it was a statistical tie).
Global surface temperature anomalies
To: cogitator
I'm sure you understand that a very slight change in prevailing winds greatly affects large areas of ocean surface temperatures. Smoothing is essential along with even sampling and satellite is the only way to do that. A large part of the surface record for ocean areas is taken on islands which almost invariably have UHI (mostly airports).
The reason that you sense no resolution to the adjustments argument is that GG has moved on. The statistical methods used for adjustments have satisfied him since there are even numbers of positive and negative trends in a gaussian distribution. That should be expected from a homogenization adjustment (not an adjustment for UHI or other physical error).
As Eschenbach showed (and verified by others, e.g. http://diggingintheclay.blogspot.com/2009/12/reproducing-willis-eschenbachs-wuwt.html, the effect of homogenization is to introduce artificial trends, positive in the case of Darwin (but also negative).
While the bottom line effect is "only" about a 0.15C to 0.2C rise per century overall (depending on methods), there are drops in 1940-1970 and much faster rises in 1975-2000. The essence of what GG is missing (or hiding) is that the adjustments vary over time to create recent warming compared to the raw data. It is impossible to see that on GG's graph that adds up all adjustments over all time periods. GG repeats that several times in his replies to critics. To quote one "If you adjust down first, then up you do NOT create a total warming trend: you create two trends one cooling and one warming that sum with each other. Why would you consider only the latter? It seems many people got stucked on this. I am going to explain it better in my post in a little while." He never explained it better.
80
posted on
12/29/2009 5:47:17 AM PST
by
palmer
(Cooperating with Obama = helping him extend the depression and implement socialism.)
Navigation: use the links below to view more comments.
first previous 1-20, 21-40, 41-60, 61-80, 81-84 next last
Disclaimer:
Opinions posted on Free Republic are those of the individual
posters and do not necessarily represent the opinion of Free Republic or its
management. All materials posted herein are protected by copyright law and the
exemption for fair use of copyrighted works.
FreeRepublic.com is powered by software copyright 2000-2008 John Robinson