I never said that satellite LT measurements are no good. I have simply stated my bet (against myself) in terms of the surface record(s), which have exhibited a 0.2 C per decade trend. Remember that this is global ocean+land, and that ocean is 70% of the surface. Thus, I'm not surprised that most of the Antarctic warming is on the peninsula, because that's the area most heavily influenced by the Southern Ocean -- which is warming. Furthermore, the Antarctic interior (unlike the Arctic) is warming very little. So it's a very minor part of the trend upon which I formulated my bet.
I'm aware of the argumentation regarding surface station siting, how much or how little influence this may have on the trends. I don't want to discuss that. The records are what they are; influenced by climate warming, UHI, ENSO, deforestation, whatever, they have a roughly 0.2 C per decade warming trend. I feel that they indicate, fairly accurately, climatic trends. This engendered my question to OldProfesser:
"1) If the surface temperature record is SO bad due to loss of thermometers or siting problems, then why do skeptics think it's good enough to show global cooling over the past decade?
2) If the record is SO bad, then why does it show, consistently, the effects of major El Nino and La Nina episodes? (I even had to fix the missing image in my profile, point #4, for this!)"
To which I'll add now:
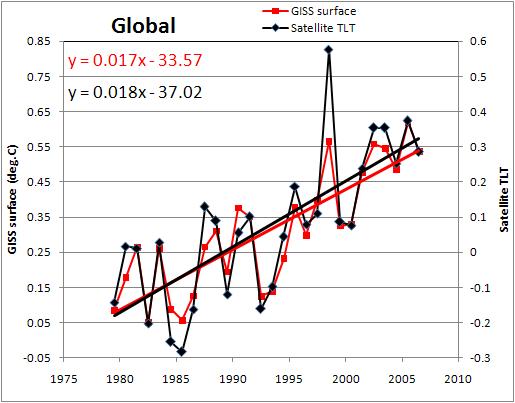
How incongruent is the shape of the surface station record for the period 1979-present with the LT temperature records over the same span?
I.e., do you believe this graph?