Posted on 05/05/2003 8:53:25 PM PDT by Ernest_at_the_Beach
HIGH LATITUDE BLOCKING AND RECORD SNOWCOVER A KEY TO THIS WINTER
Winter in Big Cities of the East Ranked Among the Coldest Since 1950
Written March 10, 2003
by Joe D'Aleo
Chief WSI/INTELLICAST Meteorologist
In our winter outlook in the fall we showed why the oceans were in a mode, which favored enhanced high latitude blocking, which would make this El Nino colder than the ones we were used to in recent decades.
The degree of high latitude blocking is measured by two climate indices, the North Atlantic and Arctic Oscillations. In recent stories, we showed how the negative mode of both modes favored colder and often snowier than normal conditions in the eastern United States and Europe, even in El Nino winters. The indices were at or near the most negative values observed since 1950 especially during the early winter from October to December.
|
| October to December Arctic Oscillation values were the most negative since 1950. This high latitude blocking helped generate large polar and arctic air masses that helped build deep snowcover and make the winter very cold for many areas in the hemisphere. |
 |
| October to February 2002/03 average snowcover for the Northern Hemisphere was at the highest level in the data set eclipsing the previous record set in the winter of 1976/77. From CPC: ftp://ftp.ncep.noaa.gov/pub/cpc/wd52dg/snow/snw_cvr_area/NH_AREA |
|
BOSTON, MASSACHUSETTS
|
|
Year
|
Average Temperature
|
|
1976/77
|
35.42
|
|
2002/03
|
35.72
|
|
CENTRAL PARK, NEW YORK
|
|
Year
|
Average Temperature
|
|
1976/77
|
37.55
|
|
1967/68
|
38.25
|
|
1977/78
|
39.35
|
|
2002/03
|
39.70
|
|
ROCHESTER, NEW YORK
|
|
Year
|
Average Temperature
|
|
1976/77
|
29.48
|
|
1993/94
|
30.38
|
|
1962/63
|
30.38
|
|
1981/82
|
31
|
|
1978/79
|
31.44
|
|
1969/70
|
31.56
|
|
2002/03
|
31.56
|
|
BALTIMORE, MARYLAND
|
|
Year
|
Average Temperature
|
|
1976/77
|
37.04
|
|
1962/63
|
37.16
|
|
2002/03
|
38.63
|
Please FReepmail me if you want on or off my infrequent ping list.
I have that book somewhere among my piles of "stuff..." it was rather amusing in places.
|
||||
|
||||
IIRC, until the mid '80's all of the eco-weenies were running around saying that industrial activity was blocking the sun, and that we were on the verge of triggering a new ice age. Then, one fine day, we all started to worry about global warming, instead.
What a viscious cycle we have created, the colder it gets (by-product of Global Warming), the more hydrocarbons we burn to stay warm. This has the effect of making it much warmer, or colder, or both, or something like that.
Burn liberals and liberal publications, not hydrocarbons.
________________________________
Arctic Oscillation (AO)
This is an index of pressure patterns over the Arctic Ocean, usually centered near the north pole. During the warm phase, the upper level pressure is lower than the surrounding region, and thus tend to cut off cold air from crossing the pole. This in turn can reduce the amount of cold air across northern Canada and can have an impact on reducing the heights over Greenland and thus negating the developing of the cold phase of the NAO, ie less high latitude blocking. The cold phase on the other hand has the opposite effect, the pressure pattern is higher than across surrounding areas which can aid in what's called cross-polar flow. This is when bitterly cold arctic air over Siberia can cross the pole and flood into North America. Also the cold phase of the AO tend to help raise heights over Greenland as well thus aiding in the development of the cold phase of the NAO and high latitude blocking.

The above image is courtesy
University of Washington
http://tao.atmos.washington.edu/analyses0500/ao_definition.html
Global Warming ... my Aunt Fanny ! :-(
So, how do we argue the global warming point?
Just deal in facts:
The reality is a doubling of atmospheric CO2 concentration over current levels, that the IPCC "story line" pretends, even if true, could not induce significant temperature change whatever its source.
Mankind's impact is only 0.28% of Total Greenhouse effect
" There is no dispute at all about the fact that even if punctiliously observed, (the Kyoto Protocol) would have an imperceptible effect on future temperatures -- one-twentieth of a degree by 2050. "
Dr. S. Fred Singer, atmospheric physicist
Professor Emeritus of Environmental Sciences at the University of Virginia,
and former director of the US Weather Satellite Service;
in a Sept. 10, 2001 Letter to Editor, Wall Street Journal
Climate Catastrophe, A spectroscopic Artifact?
Climatic temperature change, OTOH, generally gives rise to changes in atmospheric CO2 concentration through changes of biomass, warming of ocean with release of CO2 from solution with rising temperatures.
Climatic temperature is predominantly a consequence of Solar heating/cooling arising from variation of solar radiance,
Global Warming on Triton (Neptune's moon)
plus astronomical & geophysical events affecting surface & atmospheric albedo.
The Bottom Line:
|
Globally Averaged Atmospheric Temperatures
This chart shows the monthly temperature changes for the lower troposphere - Earth's atmosphere from the surface to 8 km, or 5 miles up. The temperature in this region is more strongly influenced by oceanic activity, particularly the "El Niño" and "La Niña" phenomena, which originate as changes in oceanic and atmospheric circulations in the tropical Pacific Ocean. The overall trend in the tropospheric data is near zero, being +0.04 C/decade through Feb 2002. Click on the chart to get the numerical data.
|
|
Ice Ages & Astronomical Causes Origin of the 100 kyr Glacial Cycle
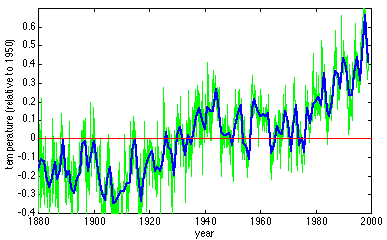
Figure 1-1 Global warming
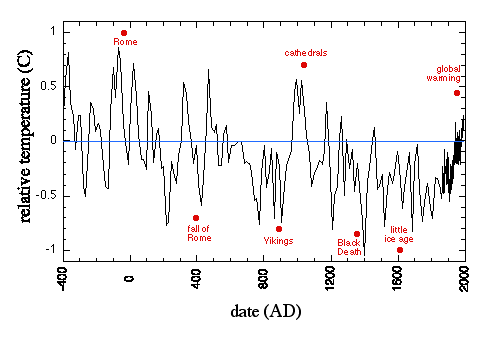
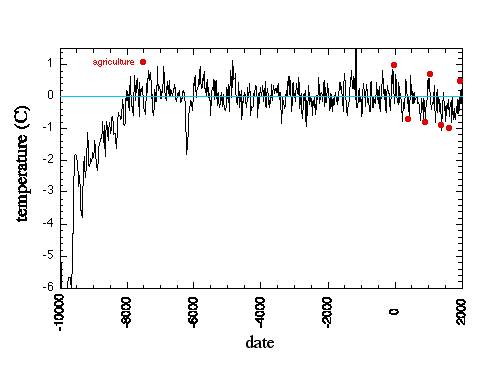
Figure 1-2 Climate of the last 2400 years Figure 1-3 Climate of the last 12,000 years
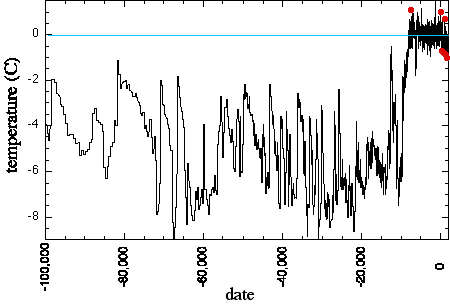
Figure 1-4 Climate of the last 100,000 years
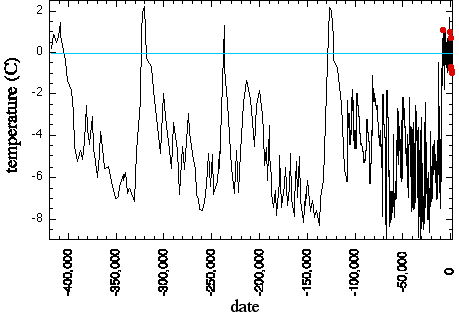
Figure 1-5 Climate for the last 420 kyr, from Vostok ice |
Seems as though there is room for substantial doubt as to any negative effect human created CO2, Methane etc. may have on our Climate future.
At least these folks believe so:
Petition Project: http://www.oism.org/pproject/s33p357.htm
During the past 2 years, more than 17,100 basic and applied American scientists, two-thirds with advanced degrees, have signed the Global Warming Petition.
Specifically declaring:
"There is no convincing scientific evidence that human release of carbon dioxide, methane, or other greenhouse gasses is causing or will, in the foreseeable future, cause catastrophic heating of the Earth's atmosphere and disruption of the Earth's climate."
Signers of this petition so far include 2,660 physicists, geophysicists, climatologists, meteorologists, oceanographers, and environmental scientists (select this link for a listing of these individuals) who are especially well qualified to evaluate the effects of carbon dioxide on the Earth's atmosphere and climate.
Signers of this petition also include 5,017 scientists whose fields of specialization in chemistry, biochemistry, biology, and other life sciences (select this link for a listing of these individuals) make them especially well qualified to evaluate the effects of carbon dioxide upon the Earth's plant and animal life.
Nearly all of the initial 17,100 scientist signers have technical training suitable for the evaluation of the relevant research data, and many are trained in related fields.
Global Warming in reverse:
|
Global Temperature and Atmospheric CO2 over Geologic Time
|
||||
- "(1) correlation does not prove causation, (2) cause must precede effect, and (3) when attempting to evaluate claims of causal relationships between different parameters, it is important to have as much data as possible in order to weed out spurious correlations.
***
Consider, for example, the study of , who examined trends of atmospheric CO2 and air temperature derived from Antarctic ice core data that extended back in time a quarter of a million years. Over this extended period, the three most dramatic warming events experienced on earth were those associated with the terminations of the last three ice ages; and for each of these climatic transitions, earth's air temperature rose well in advance of any increase in atmospheric CO2. In fact, the air's CO2 content did not begin to rise until 400 to 1,000 years after the planet began to warm. Such findings have been corroborated by , who examined the leads/lags of atmospheric CO2 concentration and air temperature over an even longer time period, finding that variations in atmospheric CO2 concentration lagged behind variations in air temperature by 1,300 to 5,000 years over the past 420,000 years."[ see also: , , , ]
- "Other studies periodically demonstrate a complete uncoupling of CO2 and temperature "
[see: , , , , , , ]
- "Considered in their entirety, these several results present a truly chaotic picture with respect to any possible effect that variations in atmospheric CO2 concentration may have on global temperature. Clearly, atmospheric CO2 is not the all-important driver of global climate change the climate alarmists make it out to be."
Disclaimer: Opinions posted on Free Republic are those of the individual posters and do not necessarily represent the opinion of Free Republic or its management. All materials posted herein are protected by copyright law and the exemption for fair use of copyrighted works.