
Posted on 06/08/2020 2:35:26 AM PDT by DoughtyOne
PING LIST - Please contact me as needed...
COVID-19 Update # 82
As of 06/07/2020 23:15 PDST United States CDC - Provisional Numbers
As of 00/00/2020 23:45 PDST Johns Hopkins University - Capture Nations Informaton
As of 00/00/2020 23:45 PDST Johns Hopkins University - Capture Counties Information
As of 00/00/2020 23:46 PDST Johns Hopkins University - Process JHU Data
As of 00/00/2020 23:59 PDST WorldofMeters - Document Core Numbers
As of 00/00/2020 23:59 PDST WorldofMeters - Capture Nations Information
As of 00/00/2020 23:59 PDST WorldofMeters - Capture States Information
As of 00/00/2020 00:00 PDST WorldofMeters - Data Processing begins...
As of 00/00/2020 ??:?? PDST Publish COVID-19 Update - 00/00/00
Thank you for stopping by to check out the COVID-19 Update.
Here you can find...
Section: 01 Commentary, Special Reports, COVID-19 Update Info, & System Notes
Section: 02 the United States Situation
Section: 03 the Global Community Situation Outside China
Section: 04 the Global Community Situation Including China with reservations
Section: 05 the Mortality Report
Section: 06 Miscellaneous Reports of Interest
Section: 07 the United States, Counties (alphabetical / case no descending)
Section: 08 the United States, States Ranking, Provisional Numbers, & Territories
Section: 09 the United States, Ranked with Other Nations
Section: 10 the End of this COVID-19 Update
Section: 11 Data Sources and a Link to My Own Spreadsheet
Section: 12 Linked Spreadsheet: Counties, States, Provisional, Territories, & Nations
Section: 13 Links to Other Resources
Section: 01
Commentary, Special Reports, and COVID-19 Update Information5
Interesting Tid-bits (hopefully)
Yesterday's Summary in a Nutshell
New Global Cases came in at 109,712 yesterday. Although it was a new record
for a Sunday, it was not an all-time reocrd, which now stands at 147,787 from
Friday 06/05.
New Cases in the United States dropped into a lower region at 18,904. That
was 3,729 Cases less than the day before and 22,819 less than the 41,723 the
day before that.
Globally Fatalities came in at 3,937 on Sunday, down from 4,001 on Saturday.
In the United States we had 373 Fatalities. That was the losest end of day
figure since March 29th, when the figure was 259. There were 702 Fatalities
on Saturday.
Declared Cases in the U. S. Passed Two Million Cases on Sunday
Sometime prior to 15:33 PDST the Seven millionth Global Case of COVID-19 was
identified. There are 3,233.757 Active Cases remaining at this time.
Global Fatalities Passes a Milestone
Sometime prior to 16:33 PDST the World lost it's 400,000th person to COVID-19
on Saturday. I know this topic is debatable. The number is out there, and I
don't want to simply ignore it.
Global Declared Cases Passed Seven Million Mark on Sunday
Sometime prior to 15:33 PDST the United States identified it's 2 millionth
COVID-19 Case. There are 1,133,272 Active Cases remaining at this time.
Large New Case Dump From Friday, Does Not Repeat
Again yesterday, the large dump of New Cases onto the rolls like what took
place on Friday in the United States, did not repeat.

Section: 02
The Following Addresses the Numbers Here in
the United Staetes of America
Here we go...

You can see the size of that idiotic blowout on Friday. Thankfully Sunday was
another day it didn't repeat.
Concept of adding in Active Cases and Serious Critical here, courtesy of amorphous
Here are more of our numbers...

The Active Cases continue to languish in the U. S., as it still remains below
the zenith number of 1,176,025 from 05/30. We had been eliminating Acitve
cases for a few days there. I hope that can return soon. I'd like to think
we've seen our largest Active Case level already.
Our Slice of the COVID-19 Pie
The growth of our slice of the pie has been dropping recently.
Here are the numbers I've been tracking, Globally Declared and Active Cases.

Our decline in the percent of the global pie returned to normal healthy
reductions on Saturday, and continued on Sunday. Looking back you can see
how we've really made progress here.
Active Cases in the United States / Chart
Unlike some of the other charts here, we should see a good rise and
fall at some point withone.
Note that this presents the one day and then 7 and 14 day averaging versions.

Remember, these are not new Declared Cases. These are remaing Active Cases.
With some wild numbers being reported on Friday, this Chart has been
disrupted a bit. It still appears we're on the back side of the curve.
Testing and New Case Figures
Requested by stocksthatgoup
Some folks have shown an interest in seeing the COVID-19 Test figures compared
to the New Cases being declared. The following Data addresses that.

The percentages of New Cases compared with Testing figures, moving down. Check
out that 3.449% single day figure yesterday. That was nice.
Here is a chart to reveal visually what the decline has looked like.

On the right there, you can see the lines weaving lower.
The U. S. Stats / w 10 Day Averaging / Fr: 03/17
Requested by: Texas Eagle
This data and chart presents things in a little different way. In the
chart it is easy to see the relationship of these numbers.
The Chart will use the data all the way back to 03/17, but the data displayed
here will only go back one month.

Here is the chart to match.

I like being able to follow the movement of these stats visully.
The lines are coming together here. That dynamic is much more pronounced
for the Global scene on the Chart addressing that lower down in the Update.
Section: 03
The Following Addresses the Global Numbers
without Mainland China
Here is the first set of Data for the Global Outside China
Territories

Yesterday's New Cases reported out as a new record for a Sunday.
Fata.lities, Recoveries, Resolved, Active Cases, and
Serious/Critical Cases - Globally, Excluding M/L China
Concept of adding in Active Cases and
Serious/Critical here, courtesy of amorphous
Here we go...

Active Cases on the Global scene are going up at a pretty fast clip.
How is the Global Community Outside China Doing,
Without U. S. numbers?
Let's see...

Look at that middle number. There was some relief in the size of that number
today. It was a Sunday, and we'll take it.

See how out of character Friday's number wound up being? Compare our
blue columns over the last few days. Look at that ridiculous jump, then
back down.


Globally, not looking good. We've dropped back down under 20k. That's
great.
The Active Cases outside China Globally / Chart
As in the U. S. version of this, we should see a good rise and fall at
some point these two.
Note that these present the one day and then 7 and 14 day averaging versions.


Remember, these are not new declared Cases. These are remaing active cases.
You can see what one nation like France can do the the charts. I appreciate
them trying to be frank about their numbers, but there must be a little better
way to accomplish that. We saw the same type of thing in the U. S. when eight
states got creative with their numbers on Friday.
Note that with France, you can see their impact on the Chart blow twice.
Special Section on France, Germany, Italy, Spain, and the U. K.
Case growth.
Let's Look at Some Numbers in Five Day Increments:


The United Kingdom, in a word, balistic...
Sweden and It's Neighbors, Who Has the Best Tactic Against COVID-19?
Sweden is doing its own thing with regard to isolating. I think most people
are aware of it by now.
Here are some numbers to help us look at this issue.


Sweden still remains a hot topic, and it's tragectory IS NOT looking good
on that Chart. In it's own group, it's not good at all. If you compare it
to some European Nations, it looks no worse.
Movers and Shakers...
I will present the top fifty nations with the most New Cases and New
Fatilities.
Here we go...

Brizil took it's turn to lead in both categories today.
Global osChina Stats / w 10 Day Averaging / Fr: 03/05
Requested by: Texas Eagle
This data and chart presents things in a little different way. In the
chart it is easy to see the relationship of these numbers.
The Chart will use the data all the way back to 03/05, but the data displayed
here will only go back one month.

Here is the chart to match.

I like being able to follow the movement of these stats visully.
I like seeing those trajectories intersect
Section: 04
The Following Addresses the Global Numbers
including Mainland China*
Mainland China's numbers are 0.002% of today's total global numbers.
A Look at Declared, Resolved, and Active Cases, Includes M/L China
End of day figures follow:

That percentage in the right column there, has slipped a bit. It's still
higher than it was a few weeks back.
Fatalities, Recoveries, Resolved, Active, and Serious/Critical
Cases Globally, Including M/L China
Concept of adding in Active Cases and
Serious/Critical here, courtesy of amorphous

Not much to say here. Big numbers getting bigger!
Section: 05
the Mortality Report
Here is the data for four entities...
Here are the figures for the growing case totals for four entities.

Anyone paying attention is already aware of the issues surrounding these
numbers. I'm not going to touch base on them every day.
Here is the chart to go along with those figures.

Charts like this one only show growth. That's why I recently took the advice
of a FReeper and added in a new chart for the U. S. and Global outside China
regions.
Here are figures revealing the daily growth for those four entities.

That 373 figure above is amazing. It's the smallest number since 03/29.
Here are two charts to go with the above data.


fatalities are dropping off across the baord.
Here, let's look at data for the U. S. broken out by itself.

Well our Fatalities have fallen off again, and I particularly like it when
the growth goes sub 1.00%. I find I like it even better when it goes
sub 500.

It's pretty easy to spot the weekly cycles isn't it..
Section: 06
Population Saturation
Here are figures revealing how many people in each population base represent one case.
I'm also showing what percent of each population base is infected at this time.

We're not doing bad here. I do wish to see us improve our postion, but it
could be a lot worse.
Nations With Lots of Cases
At the end of the day yesterday, there were:

It's hard to belive there are that many nations with massive numbers.
Daily Case Report Evaluation
I'll be keeping tabs on the daily tallies for days of the week for a while. Folks have
noticed some patterns of larger and smaller data entry on certain days, and on Fridays
sometimes the numbers get noticeably larger because of it.
And we now know Thursdays have potential to break out also. Yikes!
IMO Let's check out the numbers and a chart.


Way too much activity lately...
Section: 07
The Top 200 Counties in the U. S., by Number of Cases
This little report lists 200 Counties in the United States in declining Case numbers.
There is also a listing that is alphabetical. This report list only the entities
and the number of Cases in the two different sorts.
It will also be available as a downloadable Excel file in Section 12.

Section: 08
States of the Union and the District of Columbia, Compared to Each Other
Each of these pages is sorted differently. Look at the red header above
the columns to see which column was used for the sort on any given page.

For your review...

For your review...

For your review...

For your review...

For your review...

For your review...

For your review...

For your review...

For your review...
If this area interests you, please use this LINK to the source, and review
the lengthy description and explanation of it's development process.
There are two reports. The presentation above comes from the second one,
and the detailed segmented information below it, may interest you.

These can now also be found under the states on the Alphabetical list. The
states and these entity's numbers should be combined to match that of the
U. S. figures each day.
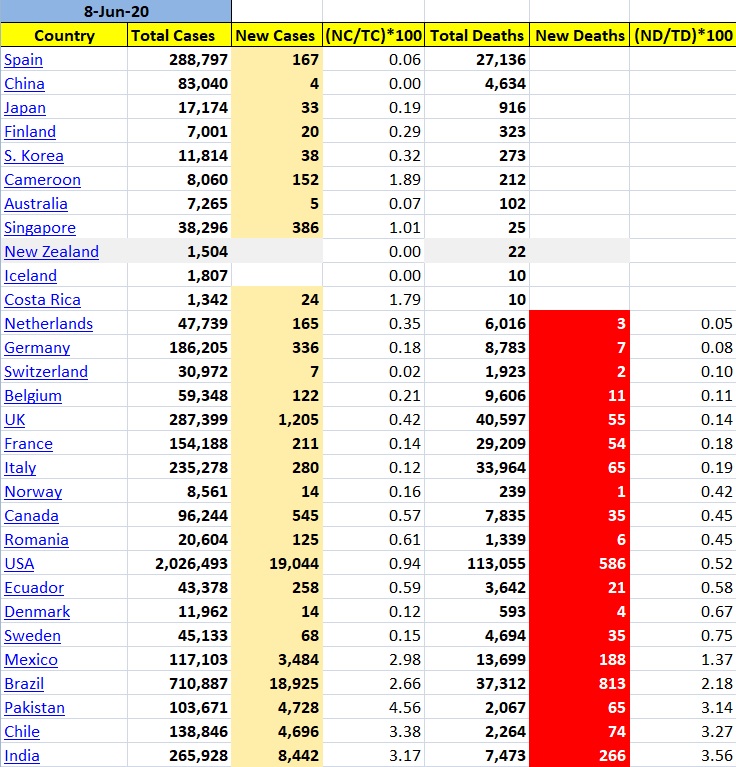
Section: 09
The United States, Where it Ranks With Other Nations?
Each of these pages is sorted differently. Look at the red header above
the columns to see which column was used for the sort on any given page.
The U. S. will be highlighted red here so we can find it easily in the list.
There was 215 nations on this list last night now. I didn't want to post
seven lists with 215 nations on it, so I picked the top 50. Coincidentally,
one report category had the U. S. at 41st, so it wasn't showing up on the
list with the 31 top nations on it. That wasn't the reason why I extended the
list length, but it did work out well.
I work on the nations right next to the states on my spreadsheet. The
states with the District of Columbia come in at a total of 51 lines.
I decided to keep the international reports near that length, and 50
was good enough.
Here we go... for your review.

For your review...

For your review...

For your review...

For your review...

For your review...

For your review...

Yesterday we moved up from 31 to 30. A few weeks back we were stuck down
at 43.
Section: 10
Here is what it is all about. From January 20th to the present.

This concludes our look back at yesterday's data. Take care...

Section: 11
Data for this Report Sourced From:
LINK WorldoMeters
LINK Johns Hopkins University
The Center for Systems Science and Engineering (CSSE)
LINK United States Center for Disease Control - Provisional Numbers
Listed in the order of current utilization...
LINK You are Invited to Review My COVID-19 Spreadsheet (XLSX)
There is not an XLS version available for distribution at this time.
Section: 12
Other Features:
LINK US Counties200, States & DC51, Territories & Other Entities11, Nations214,
and the CDC Provisional Counts53
Five Excel Spreadsheet datasets you can sort for your own studies...
Section: 13
Links to other resources:
I cannot vouch for these sites. Please use your own judgement.
LINK Adventist Health Coronavirus Resource Hub - Scroll down for useful info
LINK Antibiotic Vitamin, the (Vitamin D)
Good article on Vitamin D's likely role in prevention of infection. Thanks Blam.
LINK CDC Data for Download - Scroll down - Excel required. Includes death stats.
LINK CDC National Center for Health Services
Provisional deaths as determined by review of vital documents. Much lower...
LINK CDC Secondary Data and Statistics - Portal Entry / Look around
LINK Coronavirus (COVID-19) Map
LINK Coronavirus infection risk may be reduced by Vitamin D
by Former CDC Chief Dr. Tom Frieden
LINK Coronavirus Spread Quickly Around the World in Late 2019, Study Shows
the University College London Genetics Institute
LINK COVID-19 Deaths Broken Out by Thirds, 05/07/20 Map of US Counties
Very revealing display of Concentrated Death Zones - thanks hoosiermama
LINK COVID-19 First U.S. Case, Treatment, features Remdesivir
New England Journal of Medicine article
LINK Cytokine Storm, med Actemra, Physician near death saved
LINK Diamond Princess Review at 634 Case Point of Eventual 712
LINK Hydroxychloroquine Article: International Poll
Daily Mail Reports, Most Effective Treatment According to 6,000 Physicians
LINK Hydroxychloroquine Has about 90 Percent Chance of Helping COVID-19 Patients
the Association of American Physicians and Surgeons, reports 91.6% of patients improved clinically
LINK IHME - Institute for Health Matrix and Evaluation
LINK National Institutes of Health - Cornavirus (COVID-19)
LINK Nasal Irrigation is the Key, COVID-19 Related
LINK New York City - interesting breakdown, borough, age, sex
LINK On the Origin of CCP Virus, A Documentary Movie (turn up the sound)
Epoch Times: I highly recommend this very well documented report.
LINK Rt COVID-19
Calculates and displays the Rt Factor for each state. Thanks FreedomPoster.
LINK World Health Organization

•Blue line represents projected death totals.
•Yellow line is actual death totals based on WorldofMeters.info data.
•Purple line is actual case numbers offset by 14 days.
•Red line represents projected daily deaths.
•Black extension lines are trend lines.
Country comparisions:
Clearly, you want to find fault with me because I say basically what the public health officials are saying. And you have decided that none of the experts know what they are talking about, therefore neither do I. It looks like your "information" comes from questionable sources like "Plandemic" and you don't want to see any real analysis because for some reason, you find the pseudoscience more appealing. Don't expect any real scientist to validate your belief in pseudoscience, it isn't going to happen.
You have demonstrated that you do not understand anything about infectious disease spread or microorganism biology.
Point by point:
In all your Ph.D. glory you picked an RO that has been demonstrated to be incorrect.
First, the correct term is R0--R zero, not R O. If you have evidence that the R0 I used for Covid-19 of 2.5 is not within the range of R0 values that have been published in various sources, provide that evidence. Don't just pull something out of your rear without any validation or evidence whatsoever. Furthermore, for the purpose of calculating the spread of the disease, the R0 I used is rather arbitrary. I used values of R0 = 2.5 with each round of infection lasting 9 days, but I could have just as easily used a different R0 and a different round of infection. Also, since you clearly believe that Covid-19 jumped from 27 cases in December to millions of (asymptomatic) cases in January--do you even have a clue that you are claiming that the R0 of Covid-19 is orders of magnitude higher than the R0 of any pathogen ever known?
Combine this with real scientific data that hypothesize that lock downs and mitigation make no difference — and you are stuck with that you are just plain wrong.
I think I already mentioned that "Plandemic" is not, in fact, a credible source of scientific information. The fact that you do not believe that lock downs, social distancing, etc., had any effect on the course of disease only illustrates further your lack of any understanding of disease transmission processes. Here is a paper on transmission of respiratory viruses: Transmission routes of respiratory viruses among humans. Read it and then explain, using real scientific terms and concepts, why you believe that mitigation measures have no effect. For bonus credit, explain how the 6 foot social distance was derived. Feel free to download and read any of the references linked within that paper.
As for your tenuous grasp on antibodies — there is CLEAR evidence as published by peer reviewed sources that previous corona virus infection confers cross immunity because they are in the same class. You have also not accounted for the two papers that demonstrate attenuation of the virus to less virulent and less severe
So you mention cross immunity of antibodies. Kudos for actually using a scientific term. Just wondering, do you also believe that an antibody test can be specific for Covid-19? Hint: if you do, then you do not understand the mechanism of cross immunity, or cross reactivity. Also, if you are going to mention "two papers", you should provide links to those papers. That is what people do when they actually have facts on their side. If they don't have facts, they only make vague mentions of supposed evidence--like you just did.
There have been numerous ARDS cases in January - April that were influenza negative and retrospectively were CoVID by clinical scenario (although I also insist that we should not include them in a confirmed data set). The fact of the matter is there are reports in the Deep South of entire schools being out in December for horrendous GI and respiratory syndromes.
Influenza like illnesses happen every year. That does *not* mean that Covid-19 has been circulating all of this time. It only means that the causative agent was not identified--either it is an influenza virus that does not show on the typical tests, or it is one of the many viruses that is not typically tested for. So there was a nasty respiratory virus circulating this winter, just like there is every winter. So what.
Combine this with OVERTESTING and the recent WHO statement that asymptomatic spread does NOT exist, and you end up with a big goose egg.
You do realize that this statement completely contradicts the narrative that somehow millions of people contracted Covid-19 simultaneously in January from the 27 people who got Covid-19 in December? "Overtesting" means that there are not cases being missed (a crucial component of the narrative). And asymptomatic transmission also means that there cannot be millions of people spreading Covid-19 while having no symptoms whatsoever (another crucial component of the narrative). So, which is it--a narrative in which millions of people suddenly contracted a disease that never existed in people before, and only a small fraction of them ever had symptoms? Or are the case counts published in various venues actually correct? It can't be both.
You said according to your work, we have 1% of the cases that we should have, leading to 200M cases in your estimation.
So, where are your calculations of the disease trajectory, using an R0 and infection rate that matches actual case data? Do you have any data on cases, deaths, recoveries? I've been keeping a spreadsheet that I have updated daily since Mar 13; where is your data? At the actual rate of growth in the first few months of the pandemic, we would reach 1 billion cases within the next couple of days. But we didn't; the rate of growth started to slow around Apr 11. As a result, the actual number of cases is 1% of what it would have been had nothing been done to alter the rate of growth.
What is your Ph.D in? What is the title of your dissertation. And for the love of all that is good, I would get your money back.
Oh, please. Do you seriously think I'm going to post anything here that would tell anyone my real identity? I'm quite please with my education, actually, at one of the top universities in the country and the world. They did a good job.
And please, please, please stop displaying your ignorance.

Disclaimer: Opinions posted on Free Republic are those of the individual posters and do not necessarily represent the opinion of Free Republic or its management. All materials posted herein are protected by copyright law and the exemption for fair use of copyrighted works.