
Posted on 05/31/2020 2:52:46 AM PDT by DoughtyOne
PING LIST - Please contact me as needed...
COVID-19 Update # 74
As of 05/30/2020 23:15 PDST United States CDC - Provisional Numbers
As of 00/00/2020 23:45 PDST Johns Hopkins University - Capture Nations Informaton
As of 00/00/2020 23:45 PDST Johns Hopkins University - Capture Counties Information
As of 00/00/2020 23:46 PDST Johns Hopkins University - Process JHU Data
As of 00/00/2020 23:59 PDST WorldofMeters - Document Core Numbers
As of 00/00/2020 23:59 PDST WorldofMeters - Capture Nations Information
As of 00/00/2020 23:59 PDST WorldofMeters - Capture States Information
As of 00/00/2020 00:00 PDST WorldofMeters - Data Processing begins...
As of 00/00/2020 ??:?? PDST Publish COVID-19 Update - 00/00/00
Thank you for stopping by to check out the COVID-19 Update.
Here you can find...
Section: 01 Commentary, Special Reports, COVID-19 Update Info, & System Notes
Section: 02 the United States Situation
Section: 03 the Global Community Situation Outside China
Section: 04 the Global Community Situation Including China with reservations
Section: 05 the Mortality Report
Section: 06 Miscellaneous Reports of Interest
Section: 07 the United States, Counties (alphabetical / case no descending)
Section: 08 the United States, States Ranking, Provisional Numbers, & Territories
Section: 09 the United States, Ranked with Other Nations
Section: 10 the End of this COVID-19 Update
Section: 11 Data Sources and a Link to My Own Spreadsheet
Section: 12 Linked Spreadsheet: Counties, States, Provisional, Territories, & Nations
Section: 13 Links to Other Resources
Section: 01
Commentary, Special Reports, and COVID-19 Update Information5
Interesting Tid-bits (hopefully)
Yesterday's Summary in a Nutshell
Once again, on the Global scene we had the highest day yet since COVID-19
numbers started coming in. The number of new cases for the day was 126,700.
That bested the 125,473 from the prior day. I had hoped this wouldn't happen,
and being a Saturday I had reason to think it wouldn't. WRONG!
How bad was it? The previous high for a Saturday, set the week before was
100,511. That was down over 8,000 from the day before it. Yesterday was up
UP 1,227 Cases from the day before. Yesterday was the third all time record
in a row. It was over 25% higher than the previous high Saturday.
The last five Saturdays were, 83,224 - 87,556 - 93,027 - 100,511 - 126,700.
The chart in the Days of the Week section, is very stark.
I have a bad feeling about this. The thought is we haven't seen anything
yet. We now have 114 nations with over 1,000 cases in them. We have 58
58 with over 5,000 in them. We have 20 with over 50,000 in them.
The New Cases in the United States came in at 23,290. That was 1,779 lower
than the 25,069 the day before. So we didn't contribute to the massive growth
in global numbers yesterday.
On the global scene, the Fatalities reported out at 4,095 for the day. That
was off 715 from the 4,810 the day before. Strangely enough, the deaths
have not gone as astronically high, during the run up in New Cases.
Our Fatalities came in at 1,015, down 197 from the 1,212 the day before.
Section: 02
The Following Addresses the Numbers Here in
the United Staetes of America
Here we go...
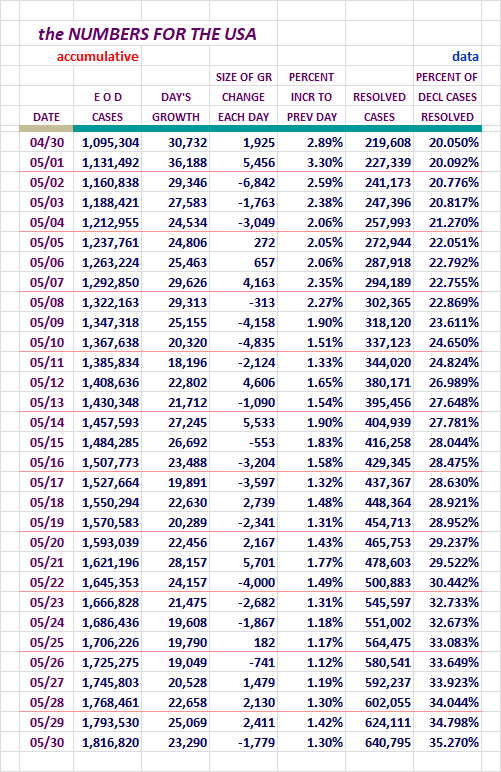
Our New Case numbers at 23,290 took a downturn from the day before when we had
25,069 New Cases. We have seen much higher numbers in days gone by. Take
a moment to review how much better off we are now.
Concept of adding in Active Cases and Serious Critical here, courtesy of amorphous
Here are more of our numbers...
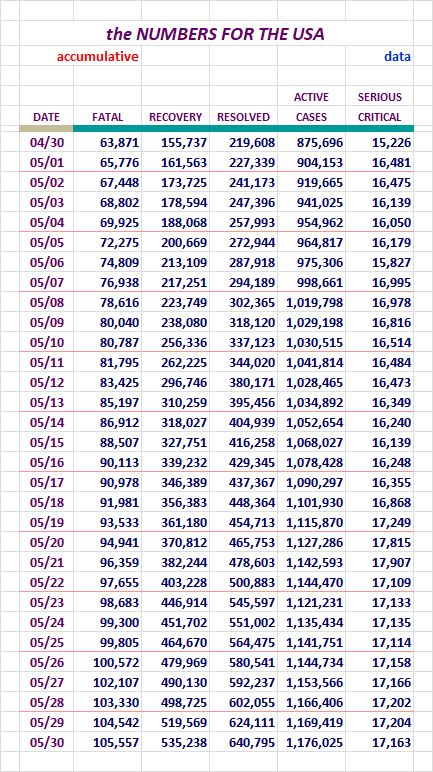
U. S. Fatalities dropped for the third day in a row, this time by a larger
amount than the day before.
Our Recoveries and Resolved Cases had a nice showing for the day, but not as
decent a showing as the day before.
Our Slice of the COVID-19 Pie
The growth of our slice of the pie has been dropping recently.
Here are the numbers I've been tracking, Globally Declared and Active Cases.
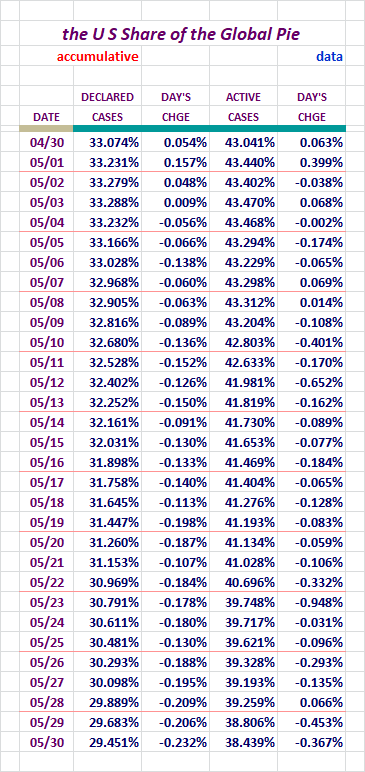
Both these figures went down again yesterday. That's a decent decline.
Nice to see.
Active Cases in the United States / Chart
Unlike some of the other charts here, we should see a good rise and
fall at some point withone.
Note that this presents the one day and then 7 and 14 day averaging versions.
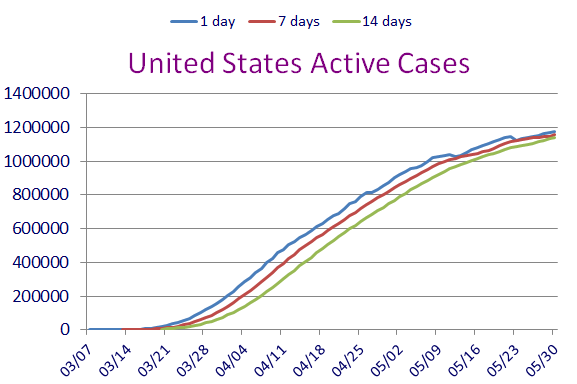
Remember, these are not new Declared Cases. These are remaing Active Cases.
That seven day average line seems to have leveled off nicely. It's still
being influenced to go up, so there will probably be some give and take
There are some interesting changes in direction there with each line, so
we'll so how it goes over the next few days.
Testing and New Case Figures
Requested by stocksthatgoup
Some folks have shown an interest in seeing the COVID-19 Test figures compared
to the New Cases being declared. This following Data addresses that.
I went back as far as I could in my records. I plan on keeping a running
30 day display here, with the Chart starting on 04/21 & 04/23 ongoing.

Seems like we're going to hover just above the 1 in 20 cases positive mark,
for a while.
Here is a chart to reveal visually what the decline has looked like.
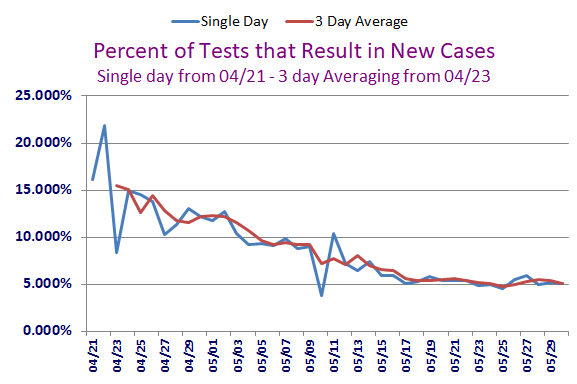
Folks can determine for themselves just how New Cases are affected by the
Testing.
Surprisingly to me, it isn't straight forward that our numbers have gone up
primarily because of testing. If it was say 30 to 50% positives there would
be a lot better case for that. Maybe others see it differently
The U. S. Stats / w 10 Day Averaging / Fr: 03/17
Requested by: Texas Eagle
This data and chart presents things in a little different way. In the
chart it is easy to see the relationship of these numbers.
The Chart will use the data all the way back to 03/17, but the data displayed
here will only go back one month.
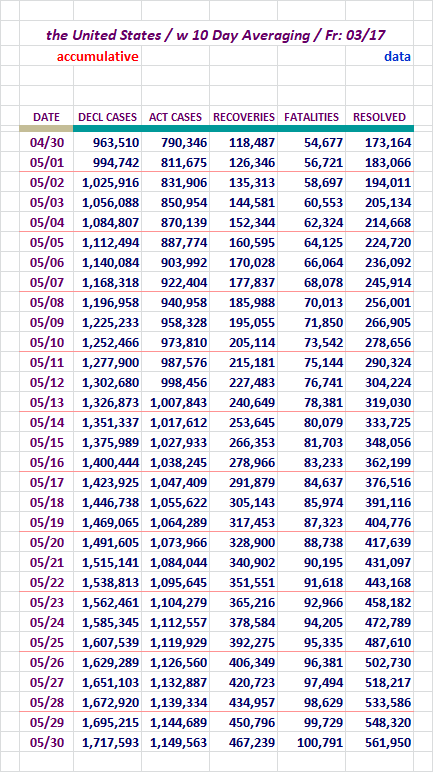
Here is the chart to match.
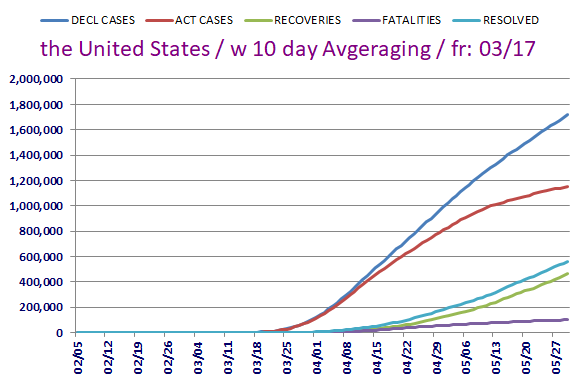
I like being able to follow the movement of these stats visully.
Section: 03
The Following Addresses the Global Numbers
without Mainland China
Here is the first set of Data for the Global Outside China
Territories
Well, there you go. If this doesn't reveal the Global picture, not sure
anything will. That's a massive number of new cases and on a Saturday, no
less. Saturdays generally report down from Fridays.
The volume was very heavy for the last two weeks. In the last 15 days we have
had a new daily record for all but one of those days, and that one only missed
by 400 and change out of about 84,000 cases.
It has pretty much been proven that all it takes is a few new hot spots around
the world, and things can go South quickly. Hopefully the U. S. can be spared
another round of that.
Fatalities, Recoveries, Resolved, Active Cases, and
Serious/Critical Cases - Globally, Excluding M/L China
Concept of adding in Active Cases and
Serious/Critical here, courtesy of amorphous
Here we go...
For your review...
How is the Global Community Outside China Doing,
Without U. S. numbers?
Let's see...
Look at that middle number. Wow. It's very high. It's a new high in this
category.
It's about 25-30% higher than five to tens days back.
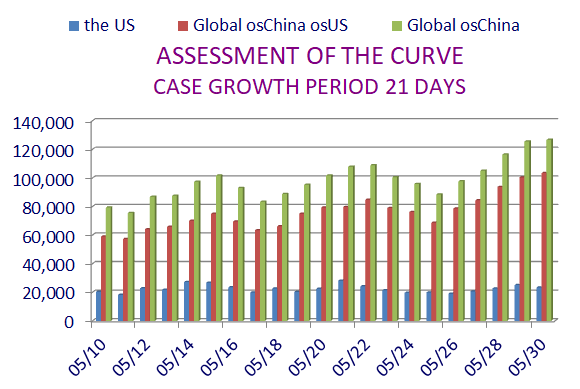
The day's number of New Cases was so high the last two days, that this Chart
had to reconfiure it's top scale to 140k, up from 120k.
Look at our blue field compared to the Global red field.
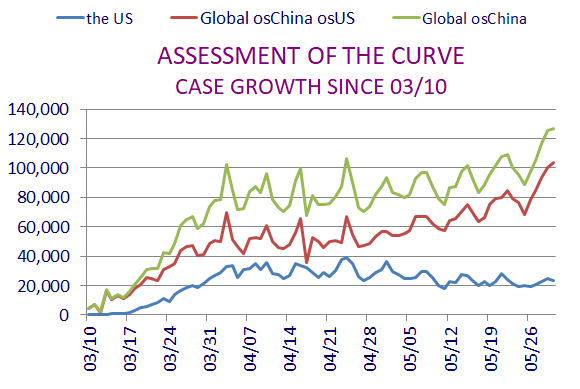
Our day was fairly decent, but Globally outside China, things are blowing up.
It's not looking good. Check out the direction of those red lines above.
It's fitting that Excel chose red for them.
The Active Cases outside China Globally / Chart
As in the U. S. version of this, we should see a good rise and fall at
some point these two.
Note that these present the one day and then 7 and 14 day averaging versions.
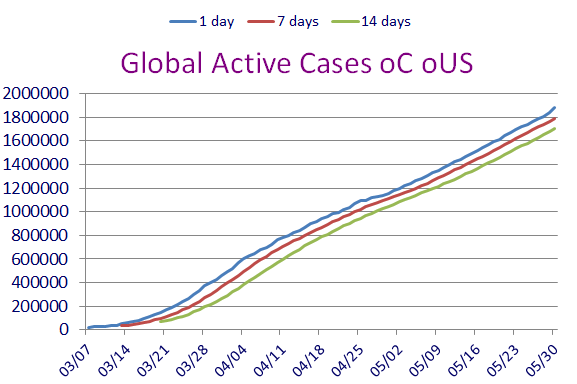
Remember, these are not new declared Cases. These are remaing active cases.
If you look closely at that last one, it shows that just when things looked
ready to flatten out, new nations caught fire with COVID-19, and up went the
count of Cases again.
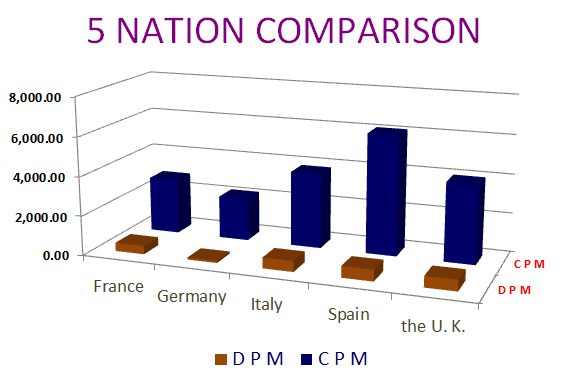
Special Section on France, Germany, Italy, Spain, and the U. K.
Case growth.
Let's Look at Some Numbers in Five Day Increments:
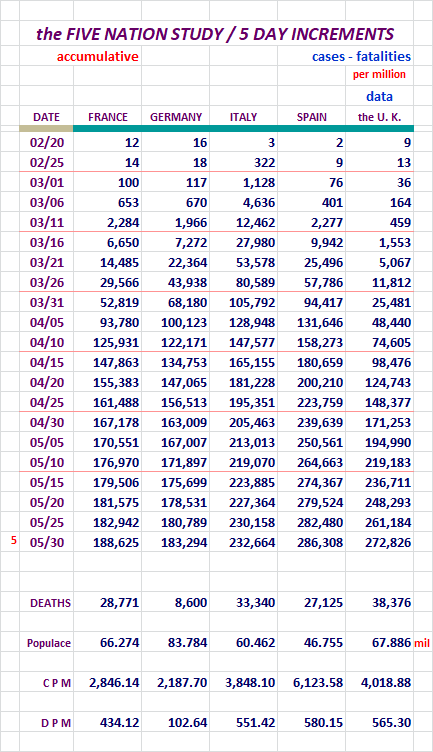
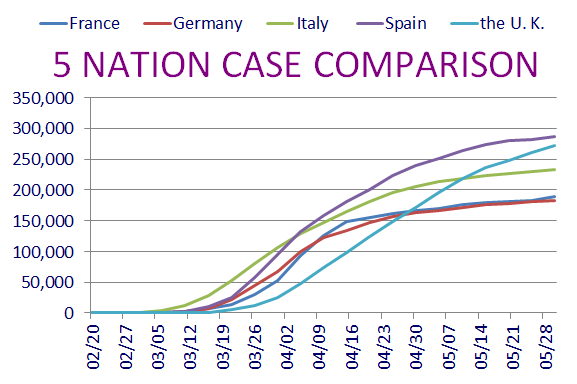
The same comments fit for about each day here.
The United Kingdom is really making a run for the top as Declared Cases go.
Its fatalities are second highest in per million terms. Wish they could hold
it togethcer better and stop the rapid growth.
Sweden and It's Neighbors, Who Has the Best Tactic Against COVID-19?
Sweden is doing its own thing with regard to isolating. I think most people
are aware of it by now.
Here are some numbers to help us look at this issue.
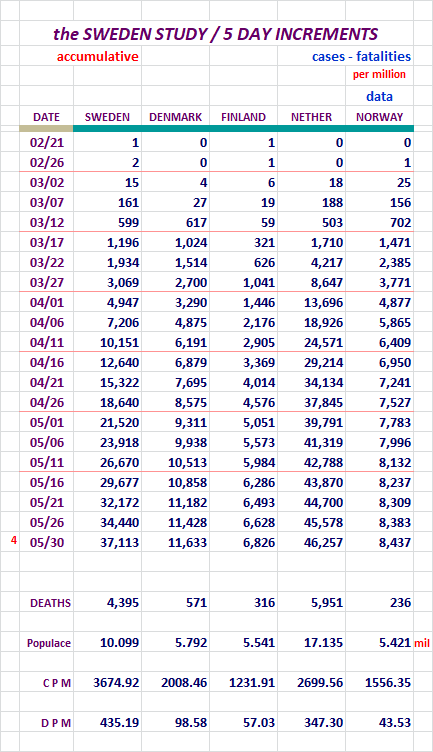
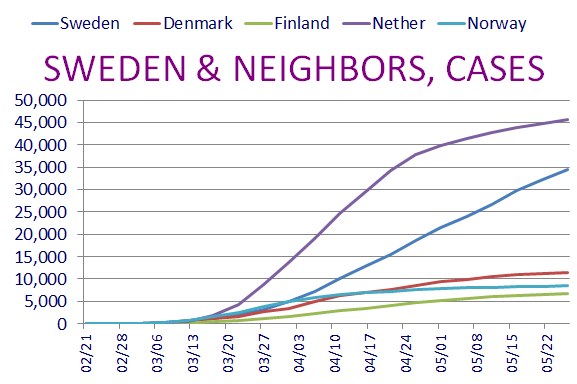
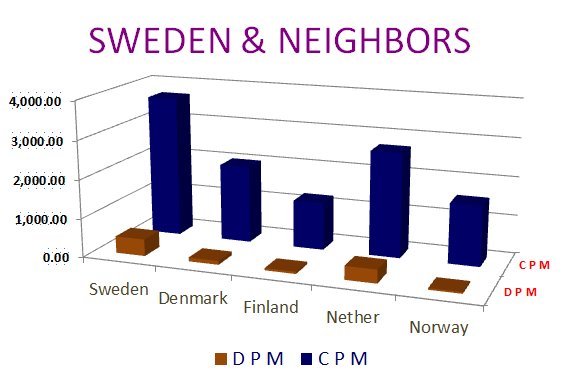
Sweden still remains a hot topic.
Movers and Shakers...
I will present the top fifty nations with the most New Cases and New
Fatilities.
Here we go...
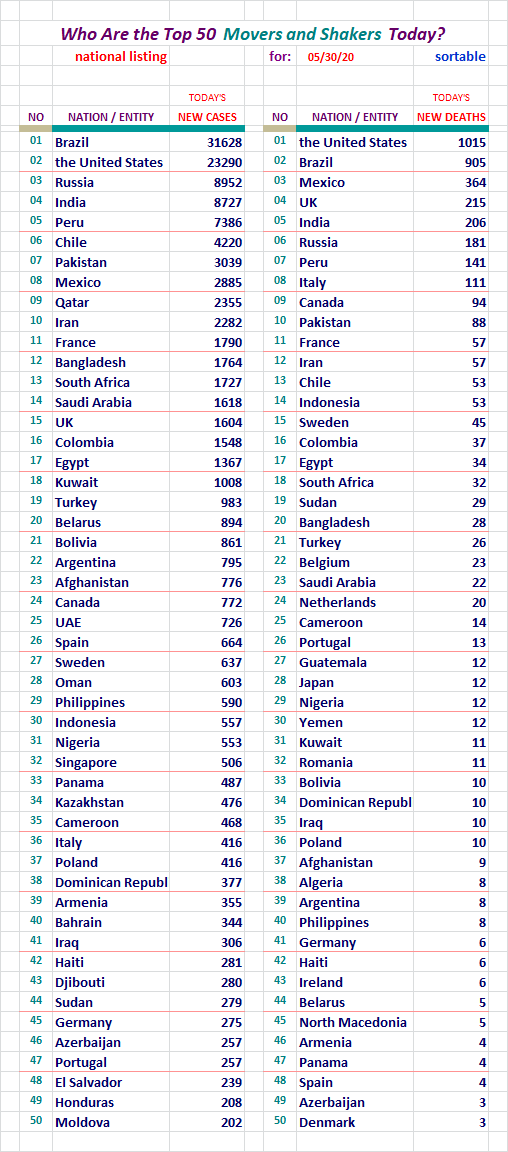
Brazil came in higher than we did for New Cases. I'd say good, but I don't
wish a lot of cases on any nation. It is what it is. Thankfully we are not
the entity that is on fire right now. We did come in with the highest deaths.
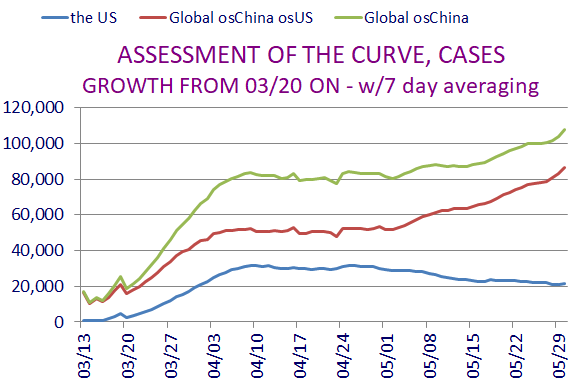
Global osChina Stats / w 10 Day Averaging / Fr: 03/05
Requested by: Texas Eagle
This data and chart presents things in a little different way. In the
chart it is easy to see the relationship of these numbers.
The Chart will use the data all the way back to 03/05, but the data displayed
here will only go back one month.
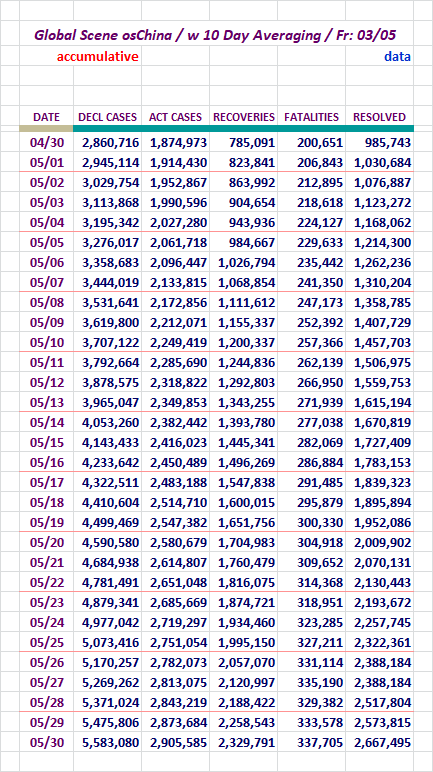
Here is the chart to match.
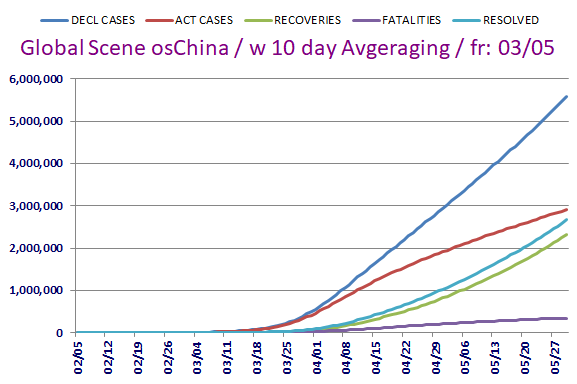
I like being able to follow the movement of these stats visully.
Section: 04
The Following Addresses the Global Numbers
including Mainland China*
Mainland China's numbers are 0.002% of today's total global numbers.
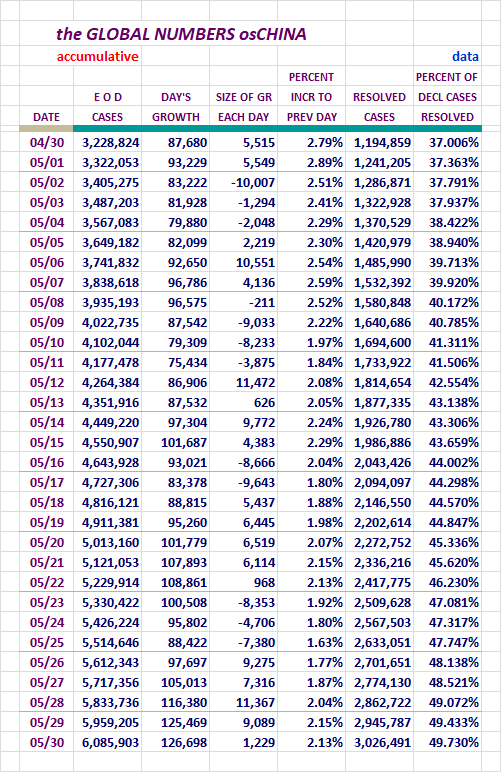
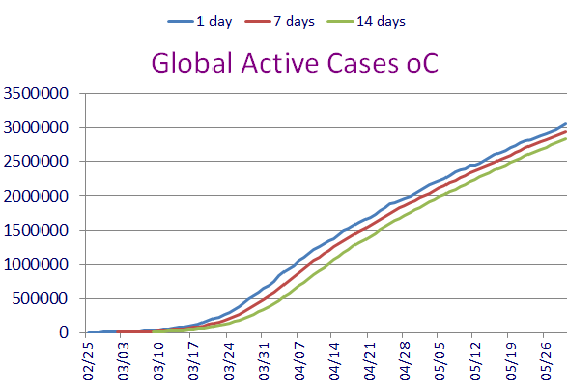
A Look at Declared, Resolved, and Active Cases, Includes M/L China
End of day figures follow:
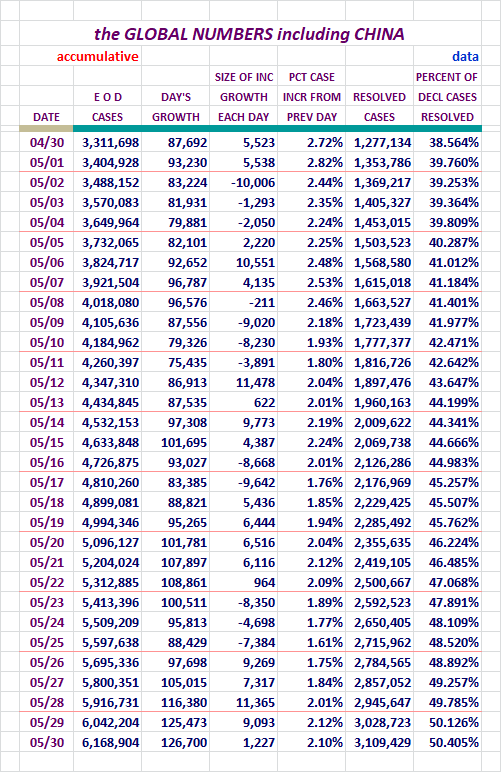
That 125,473 New Global Cases for the day is massive. Some folks may think
that higher levels of testing could be driving this. That may or may not
be true. Here in the U. S. we're only finding about 1 in 20 people tested
are infected. That number has been dropped, and is now seemingly plateaued
in the 1/20 area.
On the right that Declared Cases resolution percentage continues to grow, and
yes we finally broke out over 50.00%
Look at the increase from 04/25 to this point. Nice...
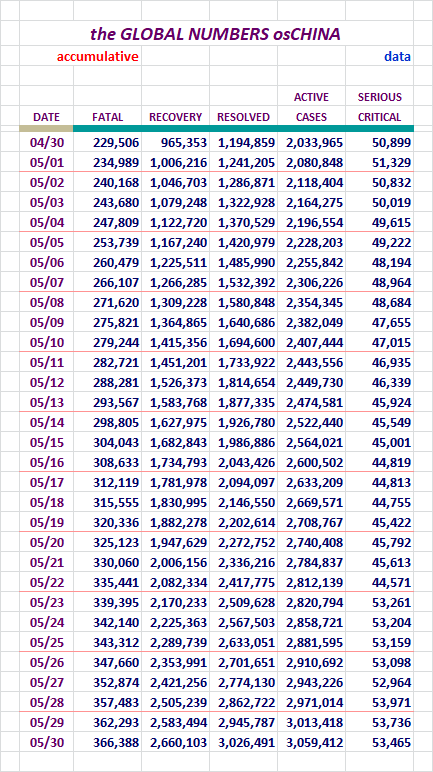
Fatalities, Recoveries, Resolved, Active, and Serious/Critical
Cases Globally, Including M/L China
Concept of adding in Active Cases and
Serious/Critical here, courtesy of amorphous
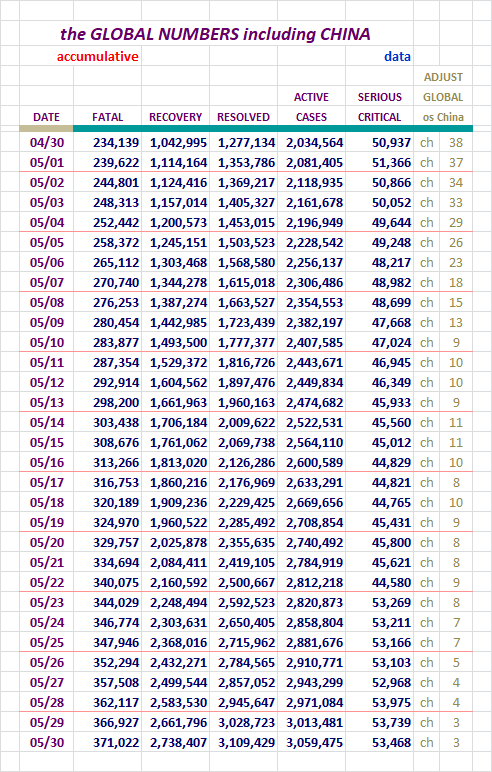
Not much to say here. Big numbers getting bigger!
Section: 05
the Mortality Report
Here is the data for four entities...
Here are the figures for the growing case totals for four entities.
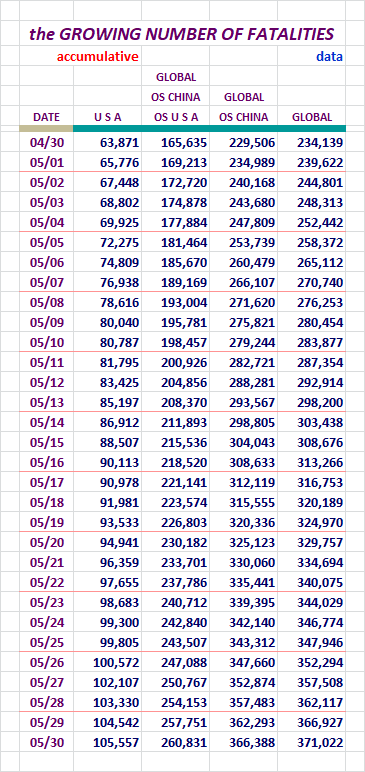
I urge folks to review the CDC's Provisional numbers bellow. I am not touting
this count (105,557), but it's out there so I mention it. We have articles all
over the forum detailing the issues with these numbers, but we have to have
reference points.
Here is the chart to go along with those figures.
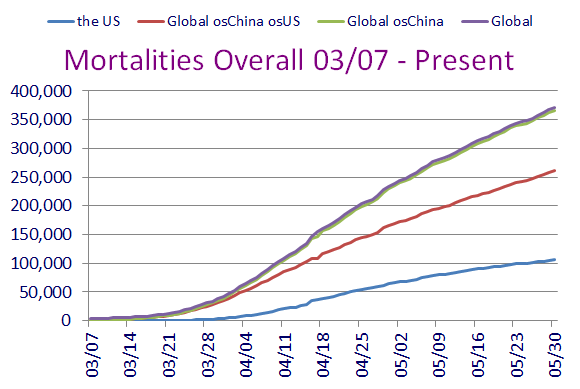
Charts like this one only show growth. That's why I recently took the advice
of a FReeper and added in a new chart for the U. S. and Global outside China
regions.
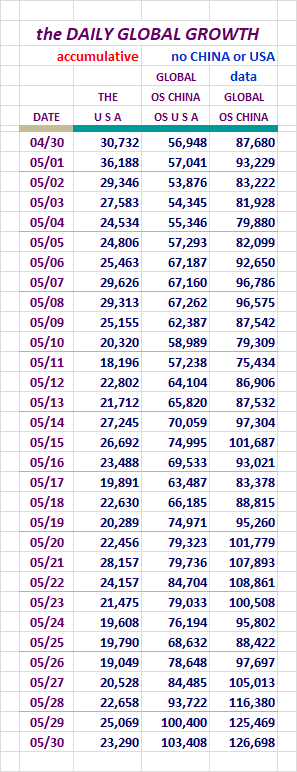
Here are figures revealing the daily growth for those four entities.

Our fatalities have been up around 2,500 at some points. Here we are in
the area around 1,000. I'm thankful for that.
Here are two charts to go with the above data.
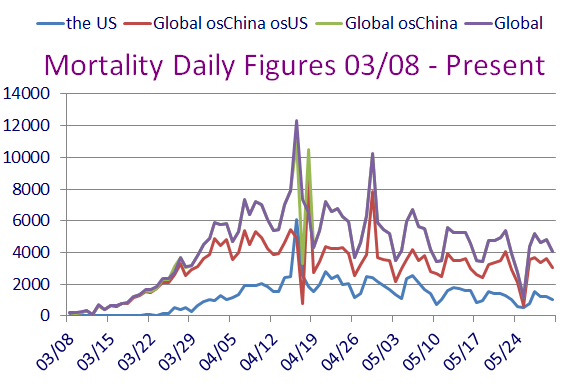
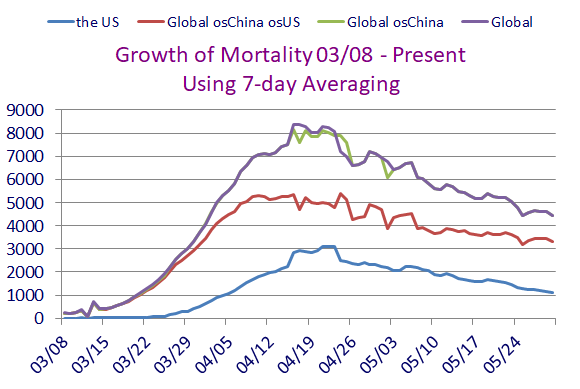
Fatalities seem to be declining, but I honestly don't know how with these
recent massive New Case days. Remember that deaths often come in very
heavy when there are heavy New Case days. It's the recoveries that lag
behind, so I'm somewhat baffled by the lower Fatality counts in the Global
community.
Here, let's look at data for the U. S. broken out by itself.
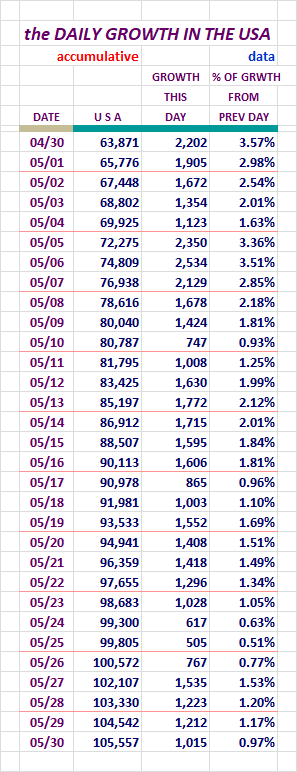
Well our Fatalities dropped off yesterday. Anything down is better, and
especially when you observe what is taking place globally.
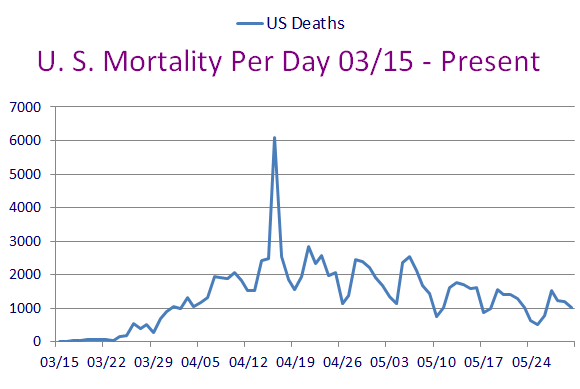
The big take away looking at these numbers, is what they looked like now
compared to early in the month. We're doing better with a long way to go.
Section: 06
Population Saturation
Here are figures revealing how many people in each population base represent one case.
I'm also showing what percent of each population base is infected at this time.

I particularly like the numbers for the U. S. here. The minimalist movement
in the wrong direction is an improvement.
These numbers have slowed down in the direction they are headed. I think we
may see them reverse directions in a few weeks. We'll see.
"We'll see", evidently my favorite catch phrase for the time being.
Nations With Lots of Cases
At the end of the day yesterday, there were:
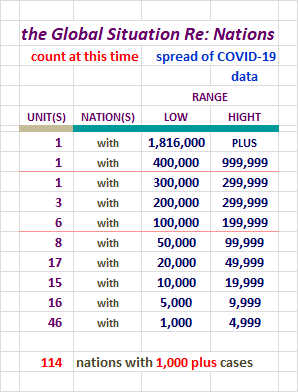
That's a whole lot of nations there. With over 1,000 in each one, we know
that over time they are potential declared cases time-bombs.
Right now in the Global scene, some of these nations are going exponential.
It's sad to see. Sadly, those folks can infect other nations too depening on
how things are handled. Other nations need to stay on top of things,
including our own.
Daily Case Report Evaluation
I'll be keeping tabs on the daily tallies for days of the week for a while. Folks have
noticed some patterns of larger and smaller data entry on certain days, and on Fridays
sometimes the numbers get noticeably larger because of it.
And we now know Thursdays have potential to break out also. Yikes!
IMO Let's check out the numbers and a chart.
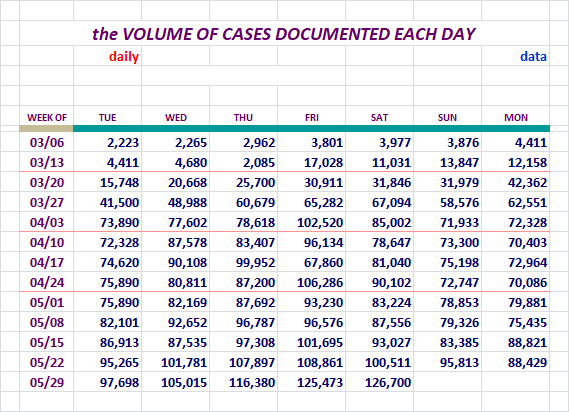
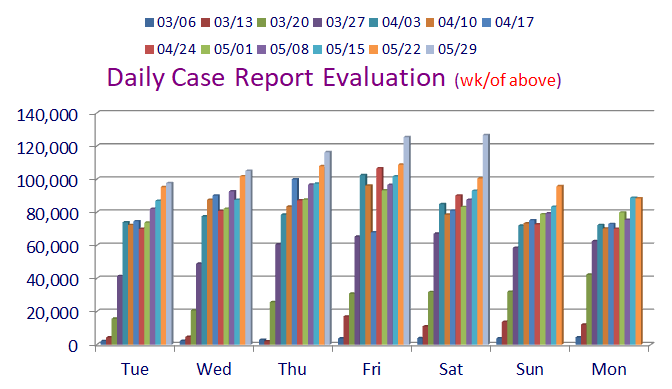
And I thought that number of New Cases for the day before yesterday were ominous.
Saturday's reporting of New Cases was a record, and not just for a saturday.
This was the highest number we've seen so far, and look how it broke out
from the prior normal levels for a Saturday.
IMO < there's no telling what today will bring. I'm thinking 112 - 120k.
Thanksfully we're here in the U. S. where the tracing may turn out to be
worse than the disease. Oh my God, what are these people thinking with?
Section: 07
The Top 200 Counties in the U. S., by Number of Cases
This little report lists 200 Counties in the United States in declining Case numbers.
There is also a listing that is alphabetical. This report list only the entities
and the number of Cases in the two different sorts.
It will also be available as a downloadable Excel file in Section 12.

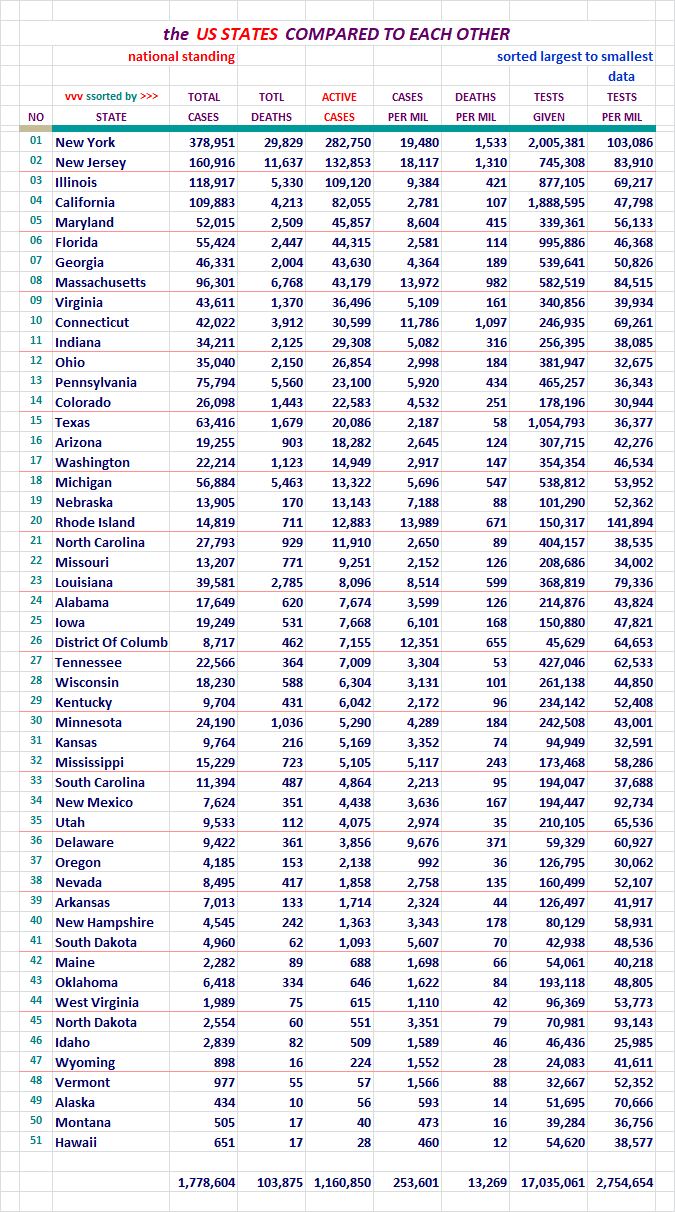
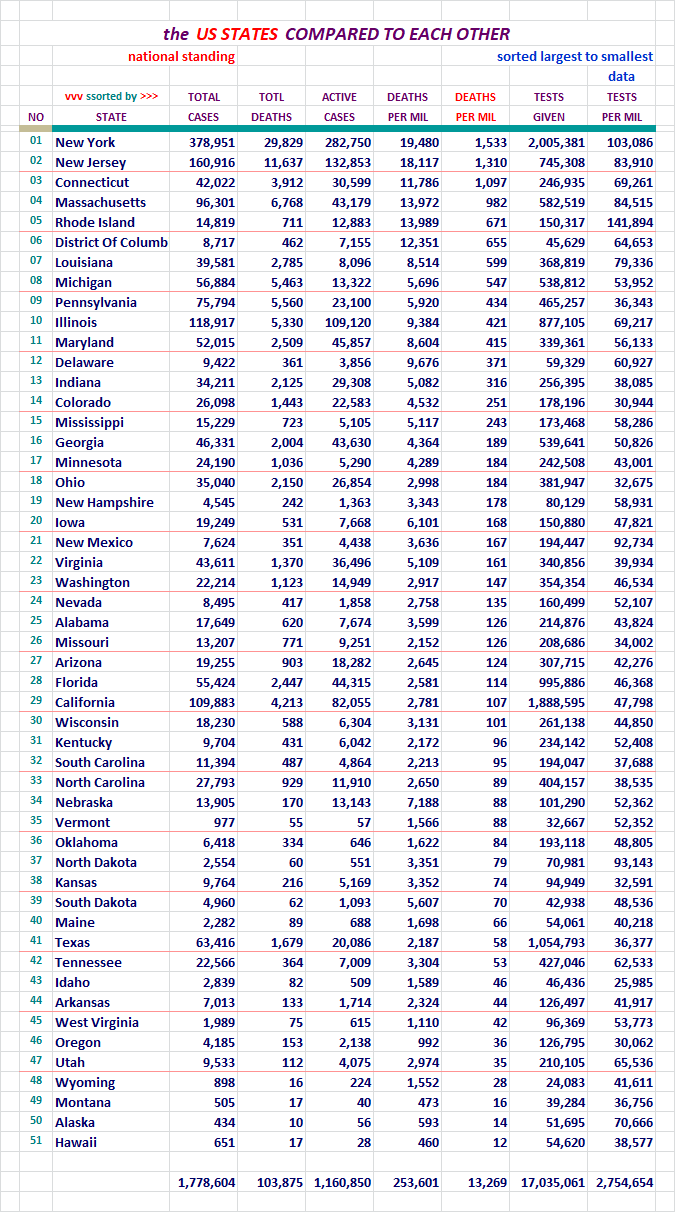
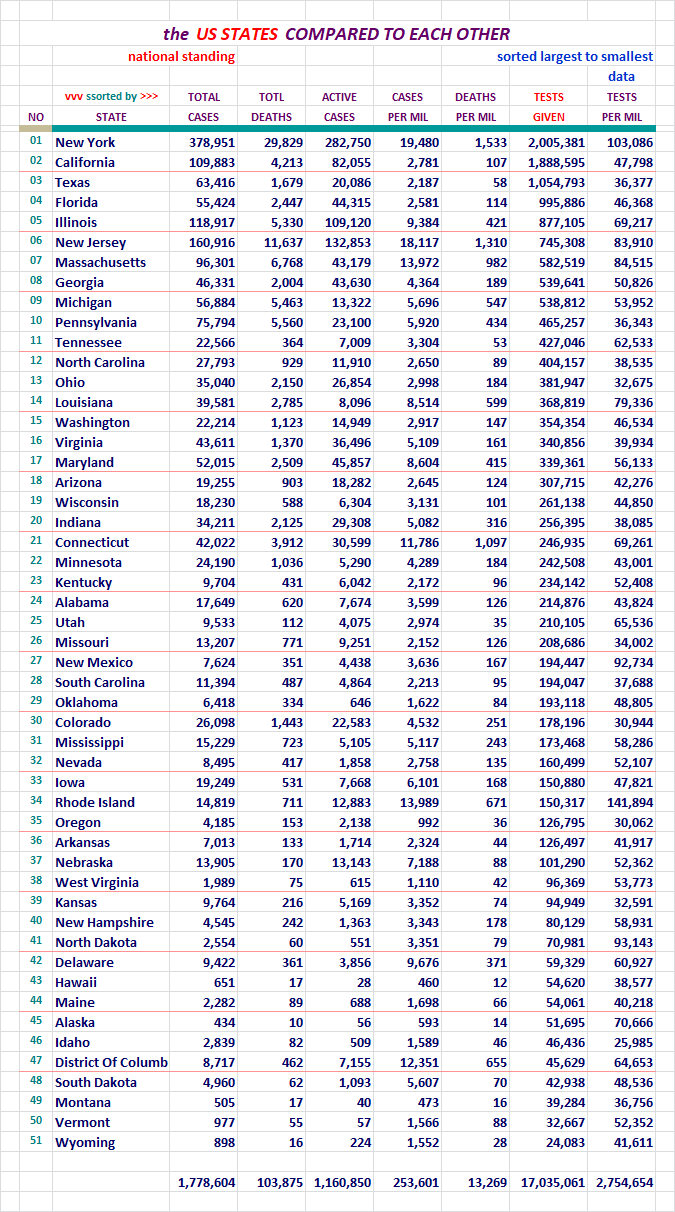
Section: 08
States of the Union and the District of Columbia, Compared to Each Other
Each of these pages is sorted differently. Look at the red header above
the columns to see which column was used for the sort on any given page.

For your review...

For your review...

For your review...
For your review...

For your review...
For your review...
For your review...

For your review...

For your review...
If this area interests you, please use this LINK to the source, and review
the lengthy description and explanation of it's development process.
There are two reports. The presentation above comes from the second one,
and the detailed segmented information below it, may interest you.
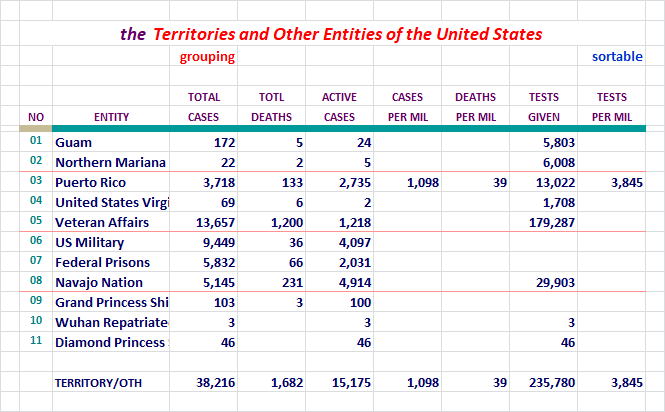
These can now also be found under the states on the Alphabetical list. The
states and these entity's numbers should be combined to match that of the
U. S. figures each day.
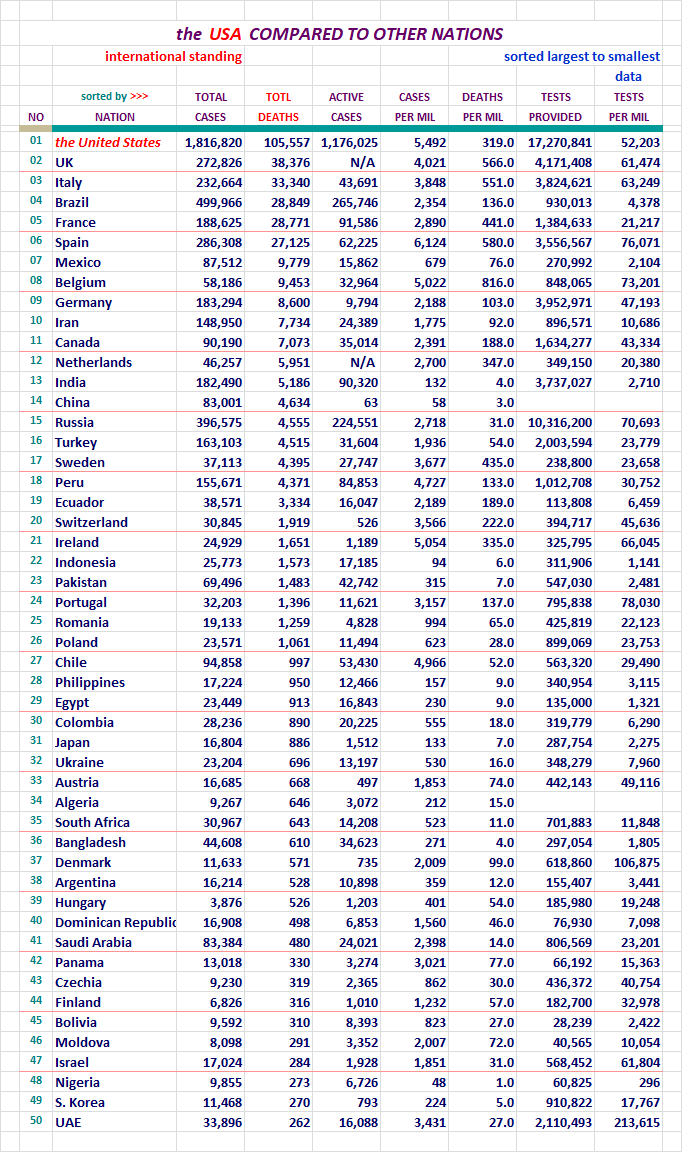
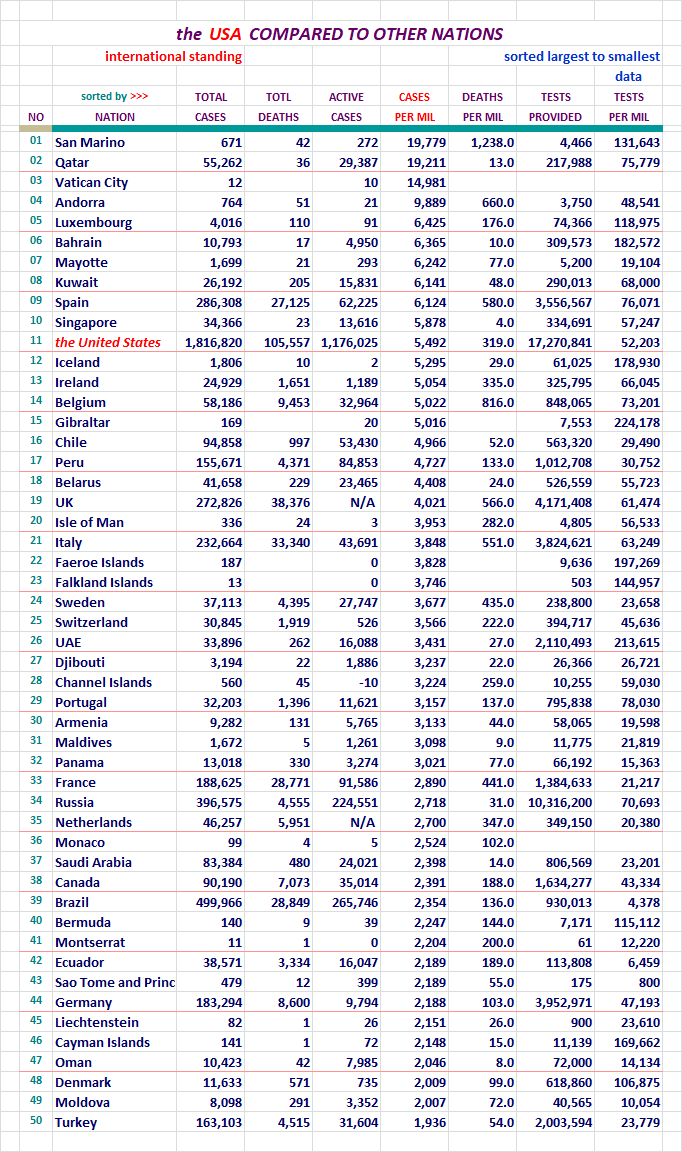
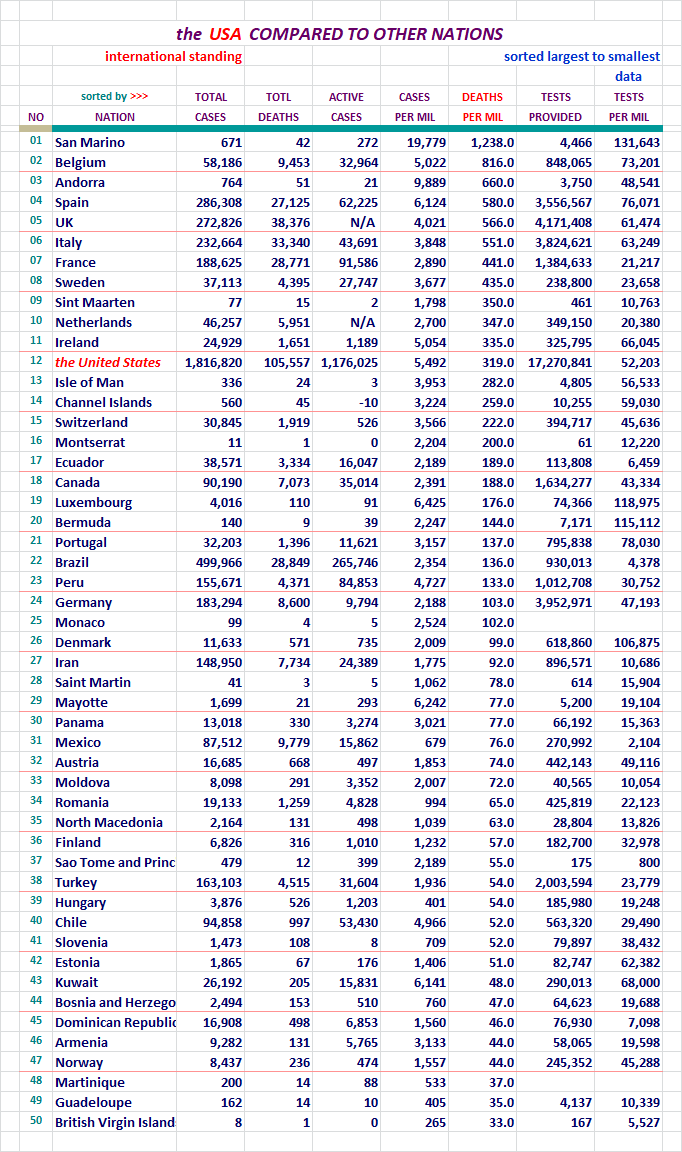
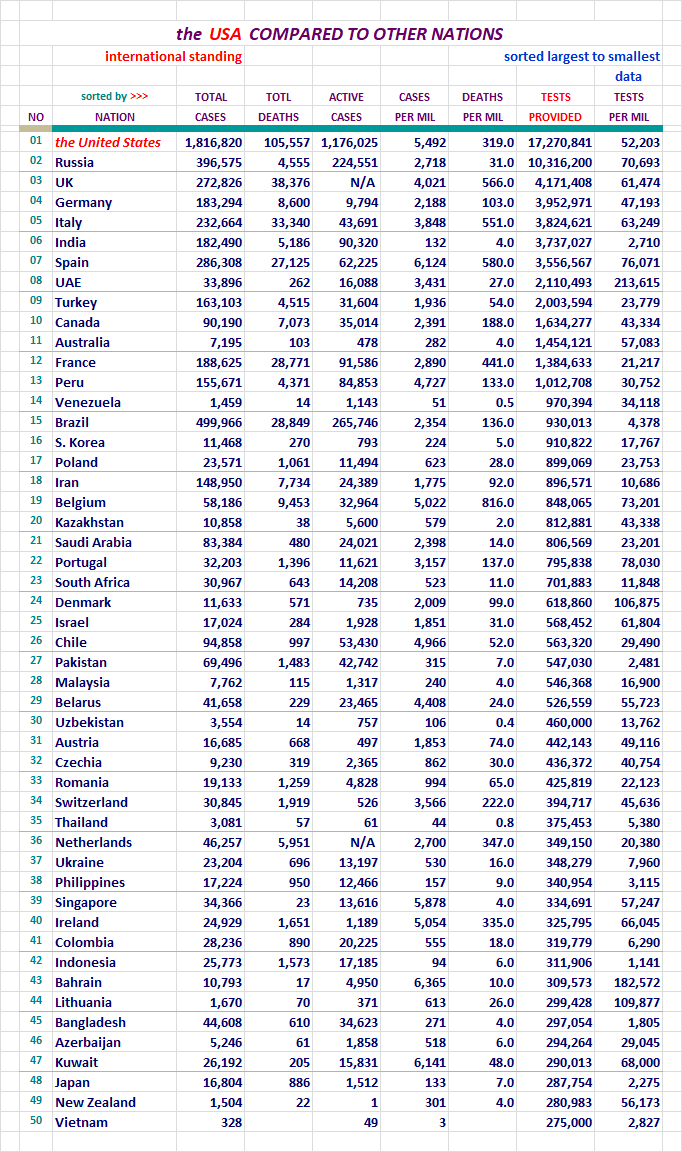
Section: 09
The United States, Where it Ranks With Other Nations?
Each of these pages is sorted differently. Look at the red header above
the columns to see which column was used for the sort on any given page.
The U. S. will be highlighted red here so we can find it easily in the list.
There was 215 nations on this list last night now. I didn't want to post
seven lists with 215 nations on it, so I picked the top 50. Coincidentally,
one report category had the U. S. at 41st, so it wasn't showing up on the
list with the 31 top nations on it. That wasn't the reason why I extended the
list length, but it did work out well.
I work on the nations right next to the states on my spreadsheet. The
states with the District of Columbia come in at a total of 51 lines.
I decided to keep the international reports near that length, and 50
was good enough.
Here we go... for your review.

For your review...
For your review...

For your review...
For your review...
For your review...
For your review...
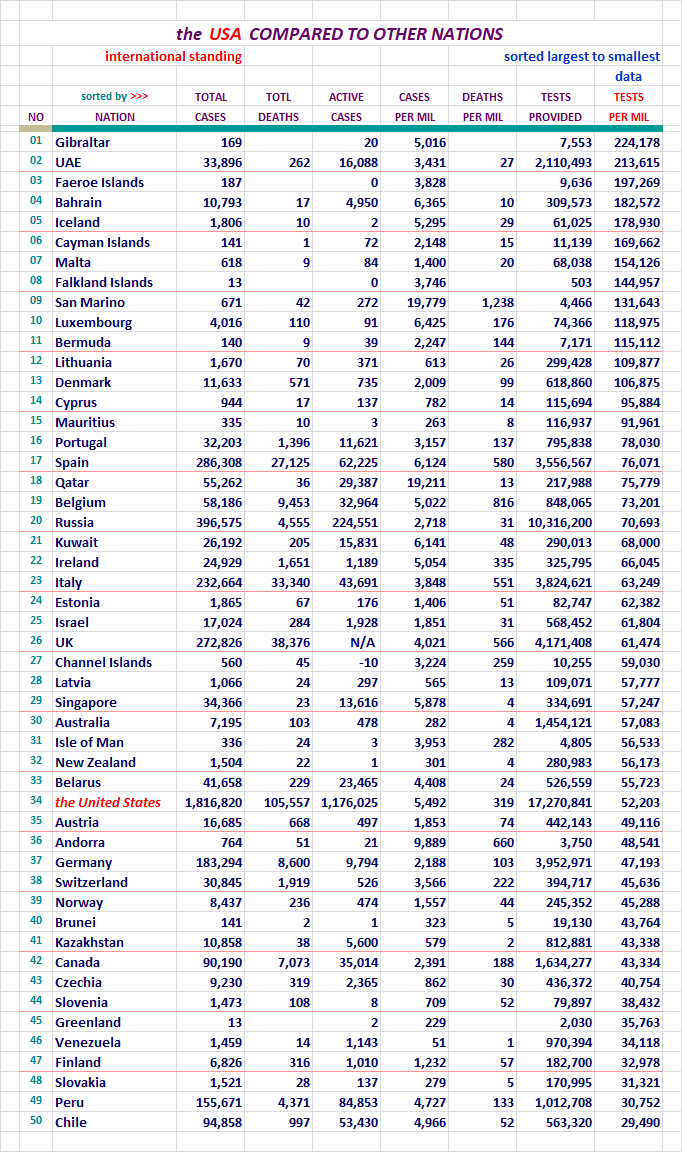
We keep moving up the chart for testing per million. We're 34th now. As
mentioned before, we were down at 43 when this first came to my attention.
Section: 10
Here is what it is all about. From January 20th to the present.
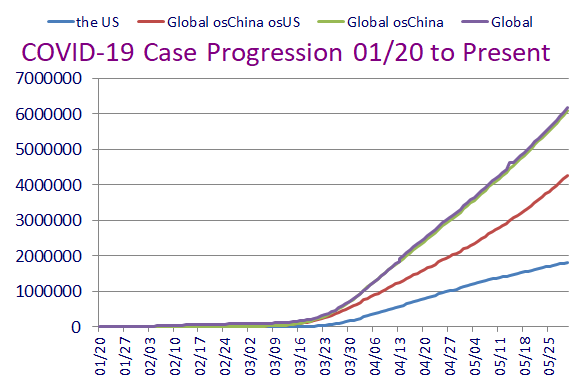
This concludes our look back at yesterday's data. Take care...

Section: 11
Data for this Report Sourced From:
LINK WorldoMeters
LINK Johns Hopkins University
The Center for Systems Science and Engineering (CSSE)
LINK United States Center for Disease Control - Provisional Numbers
Listed in the order of current utilization...
LINK You are Invited to Review My COVID-19 Spreadsheet (XLSX)
There is not an XLS version available for distribution at this time.
Section: 12
Other Features:
LINK US Counties200, States & DC51, Territories & Other Entities11, Nations214,
and the CDC Provisional Counts53
Five Excel Spreadsheet datasets you can sort for your own studies...
Section: 13
Links to other resources:
I cannot vouch for these sites. Please use your own judgement.
LINK Adventist Health Coronavirus Resource Hub - Scroll down for useful info
LINK Antibiotic Vitamin, the (Vitamin D)
Good article on Vitamin D's likely role in prevention of infection. Thanks Blam.
LINK CDC Data for Download - Scroll down - Excel required. Includes death stats.
LINK CDC National Center for Health Services
Provisional deaths as determined by review of vital documents. Much lower...
LINK CDC Secondary Data and Statistics - Portal Entry / Look around
LINK Coronavirus (COVID-19) Map
LINK Coronavirus infection risk may be reduced by Vitamin D
by Former CDC Chief Dr. Tom Frieden
LINK Coronavirus Spread Quickly Around the World in Late 2019, Study Shows
the University College London Genetics Institute
LINK COVID-19 Deaths Broken Out by Thirds, 05/07/20 Map of US Counties
Very revealing display of Concentrated Death Zones - thanks hoosiermama
LINK COVID-19 First U.S. Case, Treatment, features Remdesivir
New England Journal of Medicine article
LINK Cytokine Storm, med Actemra, Physician near death saved
LINK Diamond Princess Review at 634 Case Point of Eventual 712
LINK Hydroxychloroquine Article: International Poll
Daily Mail Reports, Most Effective Treatment According to 6,000 Physicians
LINK Hydroxychloroquine Has about 90 Percent Chance of Helping COVID-19 Patients
the Association of American Physicians and Surgeons, reports 91.6% of patients improved clinically
LINK IHME - Institute for Health Matrix and Evaluation
LINK National Institutes of Health - Cornavirus (COVID-19)
LINK Nasal Irrigation is the Key, COVID-19 Related
LINK New York City - interesting breakdown, borough, age, sex
LINK On the Origin of CCP Virus, A Documentary Movie (turn up the sound)
Epoch Times: I highly recommend this very well documented report.
LINK Rt COVID-19
Calculates and displays the Rt Factor for each state. Thanks FreedomPoster.
LINK World Health Organization

“Strangely enough, the deaths
have not gone as astronically (sic) high, during the run up in New Cases.”
I don’t find this surprising in the least. Much more is known about the China Virus including WHO is in most danger (seniors over 70 yrs of age and with co morbidity) and treatments are now available to mitigate and defeat the disease.
This thing is still grossly over hyped (media panic porn) because what is important is not how many are infected by the virus but how many die from it. The reality is the death rate is low and coming down steadily as more and more cases are being detected and an ever increasing number of people are shown to be asymptomatic.
Thank you again D1.
With the unmasked thugs rioting and looting these past few nights, I reckon we will have to wait for a couple of weeks to see if there is a surge in covid cases from the dudes and dudettes who were not practicing social distancing.
If there is no discernible surge in covid cases, then I believe we can safely say covid has ran its course.
“””Surprisingly to me, it isn’t straight forward that our numbers have gone up primarily because of testing. If it was say 30 to 50% positives there would be a lot better case for that. Maybe others see it differently”””
In my state of Florida they are begging people to come and be tested. In Florida you do not have to have a doctors orders to be tested, or have any symptoms, or have been in contact with another person who did test positive.
I suspect it is the same in many other states that the state health departments are begging people to be tested.
In contrast think about the situation in March or April when the only people tested were those who had respiratory symptoms, were in contact with a person who had tested positive, or were health care providers.
In March and April the USA had limited testing capability and testing was only done on those people with a high probability of actually being infected.
Also, as we increase testing of non-symptomatic people, we will occasionally find a person who does test positive and then we can immediately isolate that person so they do not unknowingly infect others.
Thus, I expect the testing to new case percentage to continue to drop from the current 5% range to the 1% to 2% range.
My US actual vs projected with adjusted trendlines for 29 May to add to your update:

•Blue line represents projected death totals.
•Yellow line are actual death totals based on WorldofMeters.info data.
•Purple line is actual case numbers offset by 14 days.
•Red line represents projected daily deaths.
I wouldn’t be surprised either, but I am seeing real
resistance to dropping below 5% right now.
You are likely correct in the 5% resistance level.
Something else to consider as testing becomes more prevalent is the number of times a person is retested after initially being tested positive.
In March and April when testing supplies were somewhat limited a person who tested positive and showed minor symptoms was probably told to stay at home for the next two weeks and only call your doctor if you feel worse.
Jump forward to May when testing supplies are readily available and that same person is now likely told to come back in two weeks to be tested again to see if they are negative.
For the past two weeks in Florida the positive test results from people that have never been tested before has been averaging about 3%
https://floridadisaster.org/globalassets/covid19/dailies/covid-daily-report-5.31.20_compressed.pdf
Until we get nationwide numbers on those people who have never been tested before, we will have to live with the data available.
Glad to hear that.
let me also add that the percent positives in Florida for all tests (including retests and first time tests) has been averaging about 5% over the past two weeks.
Thus for Florida about 2% of the positive testing results is from retests of those who previously tested positive.
Thanks for the mention.
Disclaimer: Opinions posted on Free Republic are those of the individual posters and do not necessarily represent the opinion of Free Republic or its management. All materials posted herein are protected by copyright law and the exemption for fair use of copyrighted works.