
Posted on 04/21/2020 3:17:52 AM PDT by DoughtyOne
PING LIST - Please contact me as needed...
COVID-19 Update
As of 04/20/2020 23:59 PDST
Good morning everyone.
Thank you for stopping by to check out the COVID-19 Update.
Links to Data Sources Used to Create the COVID-19 Update: Located near the bottom of this post.
Links to other resources: Near the bottom of this post.
Commentary, Special Reports, and COVID-19 Update Information3: Interesting Tid-bits (hopefully)
Another New Feature...
I have been providing the percentage of world cases that are within the United
States. Others have had certain miscomfort with that since a number of things
can impact that. I have agreed with them.
Another way of addressing where the U. S. stands in comparison to other nations,
would be to look at standings in certain categories. Starting today I will be
adding in four more charts that will list the top 31 nations in each category.
Those categories will be Cases per million, Deaths per million, Number of Tests,
& Tests per million.
These charts will be located near the bottom of the Update, just after the
United States - States and Counties lists.
the New Format
It was taking me too long to process the data before posting in morning. It was
also a problem keeping so many irons in the fire related to the information. I
was having to enter 47 bits on information in just the large number fields, and
a fair amount of it was repetitive.
Each time I would enter this data, I would have to reference other documents.
It was a pain shuffling around different places to find things. This conversion
made it possible for me to update 47 fields with just 17 entries. I've automated
a major portion of "the numbers" collection spreadsheet. This new format cut
off about forty-five minutes to an hour of time.
I'm shooting for one month's data on each of 11 topics, with from three to six
fields each. One other feature that you won't notice, is that if I make a
mistake, I'm now able to replace one graphic data set, and the information
will be corrected mid-day.
Hope you like the new format.
Yesterday Seven (said six yesterday [was thinking other than the U. S.] ), and Now
It's Eight Nations...
That's how many passed the paltry numbers China declared to the world.
They are The United States, Spain, Italy, France, Germany, the United Kingdom,
Turkey, and the most recent addition, Iran.
the Mortality Report
I am monitering the Mortality Rates Closer these days. I don't want to have
the numbers pull a u-turn on us, unless we know it's coming.
Here are the figures for the growing case totals for four entities.
As you can tell, I'm trying to give the Global Outside China section some
options, so that we can see their data split out from the others. Notice
I have it separated from China at times, and also from the US too. I don't
want our numbers to wash up over the Global outside China numbers. We
need to see what's going on in other groups, so we can see if a trend
is headed our way.
Here's the chart to go along with those figures.

It does seem like the Global figures outside China look too bad when you
separate out the U. S. figures. we don't look that bad either by ourselves,
but when our numbers are joined, things seem to take off.
Be both seem to be leveling out, but together, there doesn't seem to be
any leveling.
Here are figures revealing the daily growth for those four entities.

Here's the chart to go with it

That area on the right still looks busy, although you can pretty much follow
it today. I found that I had made a charting error yesterday, and that
didn't help any. Oops...
I would like to try to utilize some seven day averaging here tomorrow.
Here, lets look at data for the U. S. broken out by itself.

This chart tracks he daily inrease over the previous day, in the middle
column there.

The fatalities went sub 2,000 yesterday We seem to be falling a little
from about four to five days ago.
The Following Addresses the Numbers Here in
the United States of America
Numbers, although high, went in the right direction yesterday.
Declared Cases in the United States

We've fallen back bellow 30,000 new cases per day, and are residing in
the 25,000 - 28,500 neighborhood now. Hope that holds.
Fatalities, Recoveries, Resolved, Active Cases, and
Serious/Critical Cases in the United States
Concept of adding in Active Cases and Serious Crital here, courtesy of amorphous
Here's more of our numbers...

As I mentioned earlier, we have dropped below 2,000 fatalities a day again.
Glad to see that.
Our Slice of the COVID-19 Pie
The growth of our Slice of the Pie has been slowing. On the 16th it actaully
went netative for one report row on my spread-sheet. Luckily it was the EOD
figure so you could see it.
Here are the numbers I've been tracking, Globale Declared and Active Cases.

As you can see, we just keep plodding along in a slightly higher percentage
of the global cases. Others have mnentioned there are a number of factors
that could explain this, or contribute to it.
I think think it's a bood enough indicator on it's own, but I do find it
interesting. Today I added four more graphs that allow us to compare the
the U. S. and other nations. There are four metrics, and I think that
helps to let us see where we stand. The four graphs are located down
below the states and counties lists.
The Following Addresses the Global Numbers
without Mainland China
Here is the first chart for the Global Outside China Territories

Glad to see that percentage of cases resolved growing.
Fatalities, Recoveries, Resolved, Active Cases, and
Serious/Crical Cases - Globally, Excluding M/L China
Concept of adding in Active Cases and Serious Crital here, courtesy of amorphous
Here we go...

There's just a lot going on out there. Some of these charts, there isn't
much to say. You can see the figures and at least know where we stand.
How is the Global Community Outside China Doing,
Without US numbers?
Things do look somewhat better, but it's not that impressive. Hopefully
tomorrow will look better. We're still just plodding along.


Yesterday was down, but there's no overt trend to it.
I think this area could use a good day averaging chart also. It
appears to me there might be a peak and fall off there. Perhaps
it's simply going up and down in the same range, with no actual
trend.
Special Section on France, Germany, Italy, Spain, and the U. K.
Case growth.
Lets Look at Some Numbers in Five Day Increments:


Germany is looking pretty good there. They've kept their deaths down pretty
well.
France seems to have taken a turn in the right direction.
Sweden and It's Neighbors, Who Has the Best Tactic Againt COVID-19?
Sweeden is doing their own thing with regard to isolating. I think most people
are aware of it by now.
Here are some numbers to help us look at this issue.


Each day sees Sweden break farther away from the pack. Not liking the direction
it seems to be going.
Whatever Finland is doing, keep doing it... Norway looks as if it has taken
a good turn there.
The Following Addresses the Global Numbers
including Mainland China*
Mainland China's numbers were indeterminate tonight, but they've been around
0.06% in the last few days.
A Look at Declared, Resolved, and Active Cases, Includes M/L China
End of day figures follow:

That recovery percentage continues to climb. It's has grown 7.40% in the last two
weeks. That will impact our active cases. If it continues for another two weeks,
we'll be up around 40.00%. I like the thought of that.
Fatalities, Recoveries, Resolved, Active, and Serious/Crical
Cases Globally, Including M/L China
Concept of adding in Active Cases and Serious Crital here, courtesy of amorphous

Not much to say here. Big numbers getting bigger...!
Population Saturation
Here are figures revealing how many people in each population base represent one case.
I'm also showing what percent of each population base is infected at this time.

Daily Case Report Evaluation
I'll be keeping tabs on the daily tallies for days of the week for a while. Folks have
noticed some patterns of larger and smaller data entry on certaind days, and on Fridays
sometimes the numbers get noticably larger because of it.
And we now know Thurdays have potential to break out also. Yikes!
Let's check out the numbers and a chart.


Friday's do seem to have a bias in favor of larger reports of new cases.
I'll keep tracking this for at least a few more weeks to give folks a chance to detect
patterns not only on Fridays, but other days as well.
Nations With Lots of Cases
At the end of the day yesterday, there were:

That's a whole lot of nations there. With over 1,000 in each one, we know
that over time they are potential declared cases time-bombs.
States of the Union and the District of Columbia, Alphabetical & by Case Number
Idea of adding more informaton here, courtesy of Presbyterian Reporter
This little report now provides the number of cases and the deaths. I was going
to add more, but the data set I needed to pull this from, didn't provide that
information.. It's an alphabetical and cases by declining number file.
It will also be available as a downloadable Excel file, so you can do your own
sorting, beyond the two sorts I have provided here. Both the states and the counties
come on one Excell spreadsheet.

Here is the Standing of 200 Counties in the U. S.
This little report lists 200 Counties in the United States in declining Case numbers.
There is also a listing that is alphabetical. This report just list the entities
and the number of Cases in the two different sorts.
It will also be available as a downloadable Excel file, so you can do your own
sorting, beyond the two sorts I have provided here. The States and Counties are
included on the same Excel spreadsheet.

The United States, Where it Ranks With Other Natons?
This is that new feature I mentioned. The U. S. will be highlighted red
here so we can see where we rank against other nations.

We are currently 16th in Cases were million... Could be worse. If there is
one metric you'd like to fall behind on, the would probably be number two.

Well, we're 14th when it comes to fatalities per million. Would love to
drop in this ranking.

We have run an impressing number of tests, but when you look at the tests
per million, we drop significantly.

Yes, that's us at the bottom of this list. And I had to fudge a little to
document where we actually reside in this ranking. We're 42nd on a list of
thirty one nations. Oops...
Here's what it's all about. From January 20th to the present.

This concludes our look back at yesterday's data. Take care...

Data for this Report Sourced From:
LINK Johns Hopkins University
The Center for Systems Science and Engineering (CSSE)
LINK WorldoMeters
LINK You are Invited to Review My COVID-19 Spreadsheet (XLSX)
There is not an XLS version available for distribution at this time.
Other Features:
LINK US States DC51, Territories5+, and Counties200
Excel Spreadsheet with Alphabetical and Numerically descending Cases
Links to other resources:
I cannot vouch for these sites. Please use your own discression.
LINK Adventist Health Coronavirus Resource Hub - Scroll down for useful info
LINK CDC Data for Download - Scroll down - Excel required. Includes death stats.
LINK CDC Secondary Data and Statistics - Portal Entry / Look around
LINK Coronavirus (COVID-19) Map
LINK COVID-19 First U.S. Case, Treatment, features Remdesivir
New England Journal of Medicine article
LINK On the Origin of CCP Virus, A Documentary Movie (turn up the sound)
Epoch Times: I highly recommend this very well documented report.
LINK Diamond Princess Review at 634 Case Point of Eventual 712
LINK earlyAlert
LINK Hydroxychloroquine Article: International Poll
Daily Mail Reports, Most Effective Treatment According to 6,000 Physicians
LINK IHME - Institute for Health Matrix and Evaluation
LINK National Institutes of Health - Cornavirus (COVID-19)
LINK New York City - interesting breakdown, burough, age, sex
LINK World Health Organization

We know that china lies more than most but all gummints lie, and so as accurate as your compilation maybe, the input is so questionable as to make one wonder if it's worth the time?
Demographic characteristics of COVID-19 cases in the U.S. (n=551,775)4 April 19, 2020
under 18 10160 1.8%
18-44 198588 36.0%
45-64 202331 36.7%
65-74 59177 10.7%
75+ 65688 11.9%
Unknown 15831 2.9%
total 551775
Apparently what is happening is that the CDC has over 200,000 cases that they have not yet specified which age group those 200,000 people fall into.
From the demographic data we see that 72.7% of the people who have been infected with corona virus are in the working age group of 18 to 64.
What CDC is still hiding from us is the number of deaths by these same age groups.
That is important information for the American public to know.
I personally suspect the data will show that the 72.7% of the working age population (18 to 64), who have been infected, have had a very low number of deaths.
CDC also needs to publish the data on underlying medical conditions. Again, I suspect the few deaths in the working age population (18 to 64) will show that a high percentage of those people (18 to 64), who died, also had major underlying medical conditions.
This is very much needed data from the CDC so that the working age population feels comfortable about going back to work.
And the data is very much needed by the elderly and those with underlying medical conditions in all age groups to continue to stay at home.
And the fact that the under 18 population has only had 1.8% of the total infections gives support to have the kids go back to school.
Preparation, testing, and PPE.
NOT. A COMPLETE AND UTTER failure by ALL responsible parties.
Instead we went the good old fashioned dark ages way. We picked a group of people (outside of hospitals) - retail grocery and big boxstore staff to be our completely unprotected, highly exposed guinea pigs. Lots of face to face, lots of handling things.
And guess what? They ALL DIED!
NOT. No rampage, no extraordinary numbers (expect for known cesspool NYC).
Yep, like a medieval village, we sent our guinea pigs down to the town virus dump. 8 weeks later we asked them If anyone was left. Yep they said.
So let’s ask the fascist Governors, if your guinea pigs survived, do you think, maybe, white collar workers in cubicles with masks might be okay? Drive through flower shows? Even beaches?
What we learned. Our top medical institutions are in utter disarray and functionally incompetent. Politicians want to be dictators, always. NYC needs to be walled off from the USA, perhaps used for a nuclear repository.
China, Russia, and Iran hate us, duh. And the Democraps would sell America out in a heartbeat to any foreign interest. Duh, duh.
Thank you again for providing this data and analysis.
In my own analyses, I see that the worldwide rate of new infections continues to drop. This is good.
I have also been looking at the situation of cases in Maryland. I see that deaths from Covid-19 are listed as confirmed or probable (pending laboratory tests). I think that this is why New York adjusted its number—they had to wait on laboratory analysis of the samples.
And—this is a really bad time of the year for allergies. I need to go shopping, but I don’t know that I’ll be allowed into a store with allergic sniffles.
I would add...NYC Mayor DiBlasio is shocked criminals released early from prison to protect them from Covid are once again committing crimes.
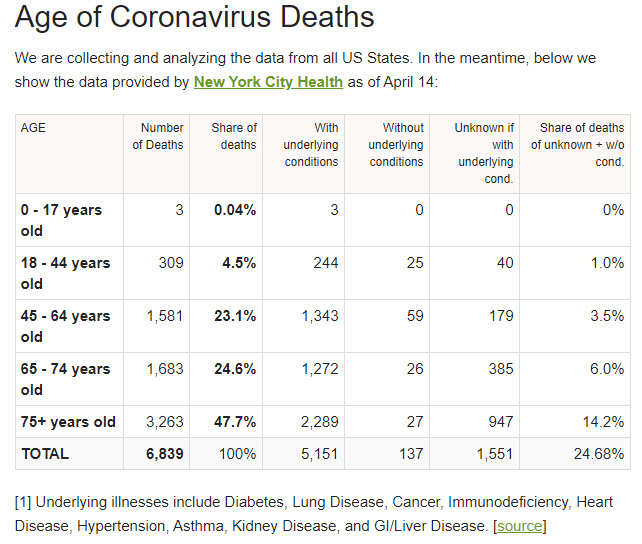
Ask and you shall receive :-). See the chart below and then go to this Worldometer link for more - https://bit.ly/2RUrmcM
This data is limited to NY, but it should scale to the world (it IS on Worldomenter) and the nation. Notice the age distribution and THEN notice the percent with underlying conditions. That number is a whopping 75%!!
I'm not sure when (or if) the world will wake up to the fact that this has been one of the biggest scams in our history! All of our institutions have failed us.
Here is more fuel to add to the scam fire (link below). LA reports 100's of thousands may have been infected. These tests are beginning to be conducted in places around the country. I have no doubt the results will be the same. So, what will these high numbers do to the death rate? I think I know.
When the books are written on this absurd chapter in our history, it is going to sound like the wildest fiction anyone would ever imagine!
click on image to enlarge
“Democraps want to destroy the Constitution, kill conservatives, and would even partition and sell off America to foreign interests.”
“You’re Crazy!”
Post-Covid:
“Where can I buy guns and ammo?”
Maybe they think we can't handle the truth.
What is my Democrat Governor Murphy and his appointed health care experts in place hiding?
I really was shocked by the revelation in the NYT just days ago that reported 40% of NJ deaths were related to the victims being in a long term health care facility. ?? Awful!
That is going to be a hidden tragedy that will go under reported by MSM. The most vulnerable were not protected....even though NJ had knowledge of Covid 19 rampant infections and death rates in Washington State's rehab and long term care facilities. NJ is so messed up and mismanaged.
Many, many thanks for finding that data showing healthy people with no underlying conditions do not die.
“This link is not working on my computer”
Sorry about that. Try this one.
https://www.worldometers.info/coronavirus/coronavirus-age-sex-demographics/
You might also try to copy and paste the link into your browser.
If none of this works, please let me know. We’ll go to plan “B.” :-).
“””I really was shocked by the revelation in the NYT just days ago that reported 40% of NJ deaths were related to the victims being in a long term health care facility.”””
We are seeing the same numbers here in my Florida county. 42% of the deaths are in nursing homes and 27% of the cases are in nursing homes.
Thus far, I have been unsuccessful in finding the number of people in nursing homes in our county of 400,000. My guess is that it is something like 4000 or 1% of the total population.
Throughout the USA our prisons are safer than nursing homes and our misguided governors are letting the prisoners free, while they lockdown the nursing homes.
thanks
that link works
bttt
Worse...families can’t even go check on their loved ones. Is anyone helping them eat to stay as strong as possible. Keeping them as clean and strong as possible. It is so sad. I would hate having someone dependent on others for their care, so isolated in a rehab or long term care site now.
Thank you. Looking forward to the numbers improving.
p
thanx again for all this.
Interesting that Pres. Trump decided to pick a combination of countries and proceeded to show\say the U.S. has better numbers than all combined, including testing.
However, if he picked your 5 - France, Spain, Italy, Germany, and the UK, the numbers combined are different than his five. with a total population near the U.S., of approx. 325 million.
Combined:
They have way more deaths.
They have a few more total cases.
They have way more recoveries.
We finally overtook them in tests.
Disclaimer: Opinions posted on Free Republic are those of the individual posters and do not necessarily represent the opinion of Free Republic or its management. All materials posted herein are protected by copyright law and the exemption for fair use of copyrighted works.