
Posted on 04/16/2020 5:29:17 AM PDT by DoughtyOne
PING LIST
Some of you have asked to be placed on the COVID-19 Update Ping List. Those who give me a
request, will be placed on the list before the next Update is posted.
If a person has expressed an appreciation for the data I'm presenting, I may add that
person to the Ping List.
Some folks don't like to be on ping lists, and I won't mind if you would rather I remove your name
from the list.
COVID-19 Update
As of 04/15/2020 00:00 PDST
Good morning everyone.
Thank you for stopping by to check out the COVID-19 Update.
Links to Data Sources Used to Create the COVID-19 Update: Located near the bottom of this post.
Links to other resources: Near the bottom of this post.
Commentary, Special Reports, and COVID-19 Update Information3: Interesting Tid-bits (hopefully)
Johns Hopkins Univeristy vs WorldoMeters
The day before yesterday, I found the Johns Hopkins University's data, less than
desired. The numbers for France fell by 13,050 cases. As of this time, they still
haven't corrected the count. Thinking perhaps there was a reason, I checked on the
WorldoMeters site. It's number was very close to what JHU had before the loss of
those cases. In addition to that, the JHU data has been as much as 38,000 cases
behind WoM's cases. A good portion of that resulted from the lost count from
France.
I've had some problems over time, and it has finally come time to switch data
sources. It was a pain in the posterior to do, but I spend six hours yesterday
not just convering my system to take WoM data, but also to keep it harmonized so
that if something should happen to WoM, I will be able to use JHU again.
There are now over 220 entities that I am tracking on my database. There were
four nations on JHU that aren't on WoM. There are some on WoM that weren't on
JHU. From now on I'm going to pick up every nation carried by either data provider.
There will be some issues with yesterday's numbers. We started out the day today
with the JHU numbers that were about 25,000 down from WoM's numbers. Then we
are ending up the day with WoM numbers that are still well over 10,000 cases
higher than JHU. So what this means is that for this one day, we are going to
be playing catch up, by jumping on the WoM system.
As best I can, I'll try to address figures I am certain were affected by this
dynamic as I make my comments here today.
This is a one day only problem, and it's not really a problem. We'll be getting
a more reliable feed of data, and we haven't really lost anything.
I honestly didn't know if I was going to be able to supply the update this
morning. Luckily, I wrapped up the repairs to the system and things ran smoothly
for the last update of the day. We're good to go...
the Mortality Report
The Mortality Figures Have Become of Interest Due to Perceptions of them Dropping
Here are the figures for the growing totals for four entities.
           	     global osChina osUS
                     .        Global osChina
DATE     the US      .        .     Global
-
03/07       17      480      497     3,594
03/08       21      685      706     3,825
03/09       26      864      890     4,026
03/10       28    1,094    1,122     4,284
03/11       38    1,428    1,466     4,638
03/12       40    1,508    1,548     4,720
03/13       47    2,189    2,236     5,429
03/14       57    2,573    2,630     5,833
03/15       69    3,227    3,296     6,513
03/16       85    3,839    3,924     7,154
03/17      113    4,599    4,712     7,954
03/18      140    5,407    5,547     8,810
03/19      196    6,557    6,753    10,030
03/20      252    7,858    8,110    11,399
03/21      329    9,411    9,740    13,049
03/22      396   10,909   11,305    14,706
03/23      428   12,632   13,060    16,563
03/24      581   14,766   15,347    18,919
03/25      753   16,890   17,643    21,308
03/26    1,301   19,484   20,785    24,077
03/27    1,704   22,762   24,466    27,761
03/28    2,229   25,293   27,522    30,852
03/29    2,488   28,226   30,714    34,018
03/30    3,170   31,345   34,515    37,820
03/31    4,055   34,987   39,042    42,354
04/01    5,112   38,837   43,949    47,261
04/02    6,095   43,743   49,838    53,160
04/03    7,403   48,208   55,611    58,937
04/04    8,454   53,012   61,466    64,795
04/05    9,620   56,563   66,183    69,514
04/06   10,943   60,542   71,485    74,816
04/07   12,875   65,937   78,812    82,145
04/08   14,797   70,417   85,214    88,549
04/09   16,691   75,718   92,409    95,745
04/10   18,747   80,667   99,414   102,753
04/11   20,580   84,948  105,528   108,867
04/12   22,115   88,813  110,923   114,269
04/13   23,644   92,745  116,389   119,730
04/14   26,064  102,347  123,411   126,753
04/15   28,554  102,789  131,343   134,685
Here's the chart to go along with those figures.
All of the figures for yesterday are going to look elevated. Please review the
last number in each section for this one day, without being too analytical regarding
the larger growth yesterday. Thanks, and sorry for the problem.
Here are figures revealing the daily growth for those four entities.
           	     global osChina osUS
                     .         Global osChina
DATE     the US      .         .    Global
-
03/08        4      205       209      231
03/09        5      179       184      201
03/10        2      230       232      258
03/11       10      334       344       54
03/12        2       80        82       82
03/13        7      681       688      709
03/14       10      384       394      404
03/15       12      654       666      680
03/16       16      612       628      641
03/17       28      760       788      800
03/18       27      808       835      856
03/19       56    1,150     1,206    1,220
03/20       56    1,301     1,357    1,369
03/21       77    1,553     1,630    1,650
03/22       67    1,498     1,565    1,657
03/23       32    1,723     1,755    1,857
03/24      153    2,134     2,287    2,356
03/25      172    2,124     2,296    2,389
03/26      548    2,594     3,142    2,769
03/27      403    3,278     3,681    3,684
03/28      525    2,531     3,056    3,091
03/29      259    2,933     3,192      166
03/30      682    3,119     3,801    3,802
03/31      885    3,642     4,527    4,534
04/01    1,057    3,850     4,907    4,907
04/02      983    4,906     5,889    5,899
04/03    1,308    4,465     5,773    5,777
04/04    1,051    4,804     5,855    5,858
04/05    1,166    3,551     4,717    4,719
04/06    1,323    3,979     5,302    5,302
04/07    1,932    5,395     7,327    7,329
04/08    1,922    4,480     6,402    6,404
04/09    1,894    5,301     7,195    7,196
04/10    2,056    4,949     7,005    7,008
04/11    1,833    4,252     6,085    6,085
04/12    1,535    3,865     5,400    5,402
04/13    1,529    3,932     5,461    5,461
04/14    2,420    4,602     7,022    7,023
04/15    2,490    5,442     7,932    7,932
Here's the chart to go with it

I don't like the look of this, and I'm sure you don't either. I thing we need
to see how things look tomorrow this time, after the new data source has had a
complete day to balance out. Hang in there.
      EOD ACCUM     INCR
          DAILY     OVER     DAILY
          DEATH     PREV   PERCENT
DATE     TOTALS      DAY    GROWTH
-
03/14        57
03/15        69       12    21.05%
03/16        85       16    23.19%
03/17       113       28    32.94%
03/18       140       27    23.89%
03/19       196       56    40.00%
03/20       252       56    28.57%
03/21       329       77    30.56%
03/22       396       67    20.36%
03/23       428       32     8.08%
03/24       581      153    35.75%
03/25       753      172    29.60%
03/26     1,301      548    72.78%
03/27     1,704      403    30.98%
03/28     2,229      525    30.81%
03/29     2,488      259    11.62%
03/30     3,170      682    27.41%
03/31     4,055      885    27.92%
04/01     5,112    1,057    26.07%
04/02     6,095      983    19.23%
04/03     7,403    1,308    21.46%
04/04     8,454    1,051    14.20%
04/05     9,620    1,166    13.79%
04/06    10,943    1,323    13.75%
04/07    12,875    1,932    17.66%
04/08    14,797    1,922    14.93%
04/09    16,691    1,894    12.80%
04/10    18,747    2,056    12.32%
04/11    20,580    1,833     9.78%
04/12    22,115    1,535     7.46%
04/13    23,644    1,529     7.46%
04/14    26,064    2,420    10.24%
04/15    28,554    2,490     9.56%
This chart tracks the daily inrease over the previous day, the middle column there.

This doesn't look good either, but we know part of the reason why things look so
elevated. Tomorrow...
The Following Addresses the Numbers Here in
the United States of America
Numbers Here Went up Considerably Yesterday
Declared Cases in the United States
             EOD    DAY'S  INCR'SD
DATE       CASES    GRWTH   GROWTH
-
03/20     19,624    5,374      539
03/21     26,747    7,123    1,749
03/22     35,206    8,459    1,336
03/23     46,442   11,236    2,777
03/24     54,893    8,789   -2,427
03/25     60,197   13,966    5,177
03/26     85,991   16,794    2,828
03/27    104,839   18,848    2,054
03/28    124,665   19,826      978
03/29    143,025   18,360   -1,466
03/30    164,620   21,595    3,235
03/31    189,624   25,004    3,409
04/01    216,721   27,097    2,093
04/02    245,559   28,838    1,741
04/03    278,458   32,899    4,061
04/04    312,237   33,779      899
04/05    337,638   25,401   -8,378
04/06    368,376   30,738    5,337
04/07    399,929   31,553      815
04/08    435,160   35,231    3,678
04/09    466,299   31,139   -4,092
04/10    501,609   35,310    4,171
04/11    529,951   28,342   -6,968
04/12    557,590   27,639     -703
04/13    582,594   25,004   -2,635
04/14    609,516   26,922    1,918
04/15    644,348   34,832    7,910
That's not to be unexpected. We picked up larger numbers in all catergories yesterday
and that's even in good categories. I hated having to change the date collection
system, but the data will be more reliable from now own. I spent six hours convering
my data collection system yesterday evening and night. I think it was worth it.
Fatalities, Recoveries, Resolved, & Serious/Critical Cases
in the United States
Concept of adding in Active Cases and Serious Crital here, courtesy of amorphous
                                               ACTIVE     SERIOUS
DATE       FATAL       RECOV      RESOLV        CASES    CRITICAL
-
03/20        252         152         404       19,220
03/21        329         176         505       26,242
03/22        396         178         574       34,632
03/23        428         178         606       45,836
03/24        581         354         935       54,296
03/25        753         619       1,372       67,825
03/26      1,301       1,868       3,169       82,822
03/27      1,704       2,622       4,326      100,513
03/28      2,229       3,231       5,460      119,205
03/29      2,488       4,562       7,050      135,975
03/30      3,170       5,507       8,677      155,943
03/31      4,055       7,251      11,306      178,318
04/01      5,112       8,878      13,990      202,731       5,005
04/02      6,095      10,403      16,498      229,061       5,421
04/03      7,403      12,283      19,686      258,772       5,787
04/04      8,454      14,825      23,279      288,958       5,870
04/05      9,620      17,977      27,597      310,041       8,702
04/06     10,943      19,810      30,753      337,623       8,983
04/07     12,875      22,711      34,586      365,343       9,169
04/08     14,797      22,891      37,688      397,472       9,279
04/09     16,691      25,928      42,619      423,680      10,011
04/10     18,747      27,314      46,061      455,548      10,917
04/11     20,580      30,502      51,082      478,869      11,471
04/12     22,115      32,634      54,749      502,841      11,766
04/13     23,644      36,948      60,592      522,002      12,772
04/14     26,046      38,820      64,884      544,632      13,473
04/15     28,554      48,708      77,262      567,086      13,487
We bumped up over the 2,000 fatalities line again, but I wouldn't be surprised to see
us dip below that number today. Things were looking better, and with a stable data
source we'll be able to make better assessments. Things have looked good recently, and
I think we're on the right track. Wish I could have confirmed that today.
Our Slice of the COVID-19 Pie Continues to Grow
There are a number of factors than can have impact on why we have so many of the global
cases. Perhaps we're ramping up the testing more than others.
Here is what those numbers looked like at the end of the day yesterday. Maybe the virus
was here a lot earlier than we thought. It's hard to tell.
       DECLARED     DAY'S     ACTIVE     DAY'S
DATE      CASES      CHGE      CASES      CHGE
-
03/20    7.125%    1.297%    10.934%    1.552%
03/21    8.704%    1.579%    13.000%    2.066%
03/22   10.377%    1.673%    15.343%    2.343%
03/23   12.170%    1.793%    17.411%    2.068%
03/24   13.053%    0.883%    18.369%    0.958%
03/25   14.657%    1.604%    20.190%    1.821%
03/26   16.140%    1.483%    21.454%    1.264%
03/27   17.530%    1.390%    22.920%    1.466%.
03/28   18.742%    1.212%    24.126%    1.206%
03/29   19.762%    1.020%    25.289%    1.163%
03/30   20.936%    1.174%    26.777%    1.488%
03/31   22.045%    1.109%    27.885%    1.108%
04/01   23.110%    1.065%    29.120%    1.235%
04/02   24.160%    1.050%    30.482%    1.362%
04/03   24.886%    0.726%    31.057%    0.575%
04/04   25.935%    1.049%    32.400%    1.343%
04/05   26.464%    0.529%    32.866%    0.466%
04/06   27.324%    0.860%    34.153%    1.287%
04/07   27.930%    0.606%    34.854%    0.701%
04/08   28.634%    0.704%    36.125%    1.271%
04/09   29.091%    0.457%    36.790%    0.665%
04/10   29.523%    0.432%    37.363%    0.573%
04/11   29.812%    0.289%    37.872%    0.509%
04/12   30.124%    0.312%    38.500%    0.628%
04/13   30.332%    0.208%    38.714%    0.214%
04/14   30.537%    0.205%    39.364%    0.650%
04/15   30.888%    0.351%    39,489%    0.125%
I mentioned I don't like to make much of the numbers since they were larger and not
The Following Addresses the Global Numbers
without Mainland China
Global Cases have pretty much leveled off, Outside M/L China
Rather than tell you what to expect here, I'll let your see it for yourself.
One thing I can say is that this does toss a blemish on my day of the week study.
We'll have to keep in mind why this day's numbers were so big, when we look back
at the chart that will show a large jump up for yesterday.
Yes, back to still more numbers...
               EOD      DAY'S   INCR'SD
DATE         CASES     GROWTH    GROWTH - compared to day before
-
03/20      194,148     30,824     5,185
03/21      225,932     31,784       963
03/22      257,820     31,888       104
03/23      297,172     39,352     7,464
03/24      341,530     41,462     2,110
03/25      390,378     48,848     7,386
03/26      451,006     60,628    11,780
03/27      516,124     65,118     4,490
03/28      583,107     66,983     1,865
03/29      641,588     58,481    -8,502
03/30      704,051     62,463     3,982
03/31      777,887     73,836    11,373
04/01      855,389     77,502     3,666
04/02      933,937     78,548     1,046
04/03    1,036,395    102,458    23,910
04/04    1,121,349     84,954   -17,054
04/05    1,193.215     71,866   -13,088
04/06    1,265,487     72,272       386
04/07    1,349,117     83,630    11,358
04/08    1,436,669     87,552     3,922
04/09    1,519,961     83,292    -4,260
04/10    1,616,016     96,055    12,763
04/11    1,694,570     78,554   -17,501
04/12    1,767,831     73,261    -5,293
04/13    1,838,067     70,236    -3,025
04/14    1,912,638     74,571     4,335
04/15    2,003,756     91,118    16,547
Tonight's numbers from WoM were at least 20,000 higher than what JHU had online. When
Fatalities, Recoveries, Resolved, Active, and Serious/Crical Cases
Globally, Excluding M/L China
Concept of adding in Active Cases and Serious Crital here, courtesy of amorphous
                                               ACTIVE     SERIOUS
DATE       FATAL       RECOV      RESOLV        CASES    CRITICAL
-
03/20      8,110      16,393      24,503      169,645
03/21      9,740      19,995      29,735      196,197
03/22     11,305      25,485      36,790      221,030
03/23     13,060      28,470      41,530      258,538
03/24     15,347      35,256      50,603      290,927
03/25     17,643      40,467      58,210      332,168
03/26     20,785      48,084      68,869      382,137
03/27     24,466      56,801      81,267      434,857
03/28     27,522      64,777      92,299      490,808
03/29     30,714      76,342     107,056      534,532
03/30     34,515      89,989     124,504      579,547
03/31     39,052     102,121     141,163      636,724
04/01     43,949     118,092     162,041      693,348
04/02     49,838     135,204     185,042      748,895
04/03     55,611     150,014     205,625      839,770
04/04     61,466     170,309     231,775      889,574      41,993
04/05     66,183     185,921     252,104      941,111      45,633
04/06     71,485     208,635     280,120      985,367      47,201
04/07     78,812     224,264     303,076    1,046,041      47,743
04/08     85,214     253,546     338,760    1,097,909      47,990
04/09     92,409     278,059     370,468    1,149,493      49,001
04/10     99,443     299,451     398,894    1,217,122      49,692
04/11    105,528     326,847     432,375    1,262,195      50,485
04/12    110,928     352,960     463,888    1,303,943      50,735
04/13    116,389     375,551     491,940    1,346,127      51,035
04/14    128,411     407,858     531,269    1,381,369      51,490
04/15    131,343     437,452     568,795    1,434,961      51,043
When you look at those resolved cases there, the jump is over 37.5k. That's a big
Grrrrrrrr...
Flattening...
Well, you couldn't tell it by the numbers below, but I'm confident Thursday's numbers
will once again confirm we're on the right track. If not I'll give everyone a
refund tomorrow.
Lets review the situation again.
Here: (case growth)
-
                   Global (EC)         Global
           the           Minus      Excluding
          U. S.      the U. S.          China
03/29    19,826         38,955         58,481
03/30    21,595         40,868         62,463
03/31    25,004         48,832         73,836
04/01    27,097         50,405         77,502
04/02    28,838         49,710         78,548
04/03    32,899         69,559        102,458
04/04    33,843         51,111         84,954
04/05    25,401         46,465         71,866
04/06    30,738         41,534         72,272
04/07    31,553         52,077         83,630
04/08    35,231         52,321         87,552
04/09    31,139         52,153         83,292
04/10    35,310         60,745         96,055
04/11    28,342         50,212         78,554
04/12    27,639         45,622         73,261
04/13    25,004         45,323         70,236
04/14    26,922         47,649         74,571
04/15    34,832         56,286         91,118


Again, this is a problem of larger than normal data capture in one day. Back to
normal tomorrow.
Special Section on France, Germany, Italy, Spain, and the U. K.
Case growth.
Lets Look at Some Numbers in Five Day Increments:
DATE       FRANCE      GERMANY        ITALY       SPAIN     The U K
-
02/20          12           16            3           2           9
02/25          14           18          322           9          13
03/01         100          117        1,128          76          36
03/06  --     653  --      670  --    4,636  --     401  --     164
03/11       2,284        1,966       12,462       2,277         459
03/16       6,650        7,272       27,980       9,942       1,553
03/21      14,485       22,364       53,578      25,496       5,067
03/26  --  29,566  --   43,938  --   80,589  --  57,786  --  11,812
03/31      52,819       68,180      105,792      94,417      25,481
04/05      93,780      100,123      128,948     131,646      44,440
04/10     125,931      122,171      147,577     158,273      74,605
04/15  -- 147,863  --  134,753  --  165,155  -- 180,659  --  98,476
-
Deaths     17,167        3,804       21,645      18,812      12,868
-
Populace   66.274m      83.784m      60.462m     46.755m     67.886m
-
C P M 1m    2,231        1,608        2.732       3,864       1,450
-
D P M 1m      234           42          349         366         182

It was mentioned that my population numbers weren't as accurate as I would have
liked, so I updated these figures and the figures in the study of Sweden just
below. I wouldn't pay attention the numb4ers from line to line here. The
per million figures should still be accurate and worthy of comparison.
Sweden and It's Neighbors, Who Has the Best Tactic Againt COVID-19?
Sweeden is doing their own thing with regard to isolating. It doesn't seem like they
are doing too bad.
Here are some numbers to help us look at this issue.
DATE       SWEDEN      DENMARK      FINLAND      NORWAY
-
02/21           1            0            1           0
02/26           2            0            1           1
03/02          15            4            6          25
03/07  --     161  --       27  --       19  --     156
03/12         599          617           59         702
03/17       1,196        1,024          321       1,471
03/22       1,934        1,514          626       2,385
03/27  --   3,069  --    2,700  --    1,041  --   3,771
04/01       4,947        3,290        1,446       4,877
04/06       7,206        4,875        2,176       5,865
04/11      10,151        6,191        2,905       6,409
04/15      11,927        6,681        3,237       6,798 < 4 days not five
-
Deaths      1,203          309           72         150
-
Populace   10.099m       5.792m       5.541m      5.421m
-
C P M 1m    1,181        1,153          584       1,254
-
D P M 1m      119           53           13          28

It was mentioned that my population numbers weren't as accurate as I would have
liked, so I updated these figures and the figures in the study of Sweden just
below. I wouldn't pay attention the numb4ers from line to line here. The
per million figures should still be accurate and worthy of comparison here also.
Now while their case numbers don't look out of whack, I still can't figure out
why their rate of death is so much higher per million.
Whatever Finland is doing, someone should can it and sell it.
The Following Addresses the Global Numbers
including Mainland China*
Mainland China numbers make up 00.08% of today's cases globally
Nations With Lots of Cases
At the end of the day yesterday, there were:
 1 nation(s) with 600,000 plus (take a bow...)
 4 nation(s) with 100,000 to 199,999
 4 nation(s) with  50,000 to  99,999
 6 natiom(s) with  20,000 to  49,999
 8 nation(s) with  10,000 to  19,999
16 nation(s) with   5,000 to   9,999
35 nation(s) with   1,000 to   4,999
There are currently 74 nations with a 1,000 count or above...
That's a whole lot of nations there.
A Look at Declared, Resolved, and Active Cases, Includes M/L China
End of day figures follow:
           DECLAR     DAY'S  RESOLVED    DAY'S   PCT DEC      ACTIVE
DATE        CASES    GROWTH     CASES   GROWTH  CS RESOL       CASES
-
03/20 -   275,434 -  30,911 -  99,655 -  3,590 - 36.181% -   175,779
03/21     307,280    31,846   105,425    5,770   34.309%     201,855
03/22     339,259    31,979   113,540    8,115   33.467%     225,719
03/23 -   381,621 -  42,362 - 118,369 -  4,829 - 31.017% -   263,252
03/24     423,121    41,500   127,538    9,169   30.142%     295,583
03/25     472,109    48,998   136,178    8,640   28.845%     335,931
03/26 -   532,788 -  60.679 - 146,749 - 10,571 - 27.544% -   386,039
03/27     598,070    65,282   159,533   12,784   26.675%     438,537
03/28     665,164    67,094   171,077   11,544   25.720%     494,087
03/29 -   723,740 -  58,576 - 186,060 - 14,983 - 25.708% -   537,680
03/30     786,291    62,551   203,926   17,848   25.933%     582,383
03/31     860,181    73,890   220,713   16,085   25.659%     639,468
04/01 -   937,783 -  77,602 - 241,591 - 20,878 - 25.762% -   696,192
04/02   1,016,401    78,618   264,935   23,344   26.066%     751,466
04/03   1,118,921   102,520   285,706   20,771   25.534%     833,215
04/04 - 1,203,923 -  85,002 - 312,068 - 26,362 - 25.931% -   891,855
04/05   1,275,856    71,933   332,513   20,445   26.062%     943,343
04/06   1,348,184    72,328   359,618   27,105   26.674%     988,566
04/07 - 1,431,900 -  83,716 - 383,688 - 24,070 - 26.796% - 1,048,212
04/08   1,519,478    87,848   419,465   35,777   27.606%   1,100,283
04/09   1,602,885    83,407   451,259   31,794   28.153%   1,151,626
04/10 - 1,699,019 -  96,134 - 479,758 - 28,499 - 28.237% - 1,219,261
04/11   1,777,666    78,647   513,239   33,481   28.872%   1,264,427
04/12   1,850,966    73,300   544,892   31,653   29.438%   1,306,074
04/13   1,921,369    70,403   573,019   28,127   29.823%   1,348,350
04/14   1,995,989    74,620   612,427   39,408   30.683%   1,383,562
04/15   2,086,097    90,108   650,029   37,602   31.160%   1,436,068
Over the last ten days, the Global percentage of resolved cases has
The other numbers here, I'll take a pass on commmenting on them. We can get a much
better view tomorrow.
Fatalities, Recoveries, Resolved, Active, and Serious/Crical Cases
Globally, Including M/L China
Concept of adding in Active Cases and Serious Crital here, courtesy of amorphous
                                               ACTIVE     SERIOUS
DATE       FATAL       RECOV      RESOLV        CASES    CRITICAL
-
03/20     11,399      88,256      99,655      175,779
03/21     13,049      92,376     105,425      201,855
03/22     14,706      98,834     113,540      225,719
03/23     16,563     101,806     118,369      263,252
03/24     18,919     108,619     127,358      295,583
03/25     21,308     114,870     136,178      335,931
03/26     24,077     122,672     146,749      386,039
03/27     27,761     131,772     159,533      438,537
03/28     30,852     140,225     171,077      494,087
03/29     34,018     152,042     186,060      537,680
03/30     37,820     166,088     203,908      582,383
03/31     42,354     178,359     220,713      639,468
04/01     47,261     194,330     241,591      696,192
04/02     53,160     211,775     264,935      751,466
04/03     58,937     226,769     285,706      833,215
04/04     64,795     247,273     312,068      891,855      42,288  ch 295
04/05     69,514     262,999     332,513      943,343      45,898  ch 265
04/06     74,816     284,802     359,618      988,566      47,412  ch 211
04/07     82,145     301,543     383,688    1,048,212      47,932  ch 189
04/08     88,549     330,916     419,464    1,100,283      48,166  ch 176
04/09     95,475     355,514     451,259    1,151,626      49,145  ch 144
04/10    102,782     376,976     479,758    1,219,261      49,833  ch 141
04/11    108,867     404,372     513,239    1,264,427      50,624  ch 139
04/12    114,269     430,623     544,892    1,306,074      50,856  ch 121
04/13    119,730     453,289     573,019    1,348,350      51,151  ch 116
04/14    126,753     485,674     612,427    1,383,562      51,603  ch 113
04/15    134,685     515,344     650,029    1,436,068      51,138  ch  95
I know the numbers don't look good for yesterday, but I remain confident they
Population Saturation
Here are figures revealing how many people in each population base represent one case.
I'm also showing what percent of each population base is infected at this time.
                     1 CASE IN
                   THIS NUMBER                              CHANGE      CHANGE
                     OF PEOPLE                                  ON          ON
ENTITY                   04/15       04/14       04/13       04/14       04/13
-
Globally      :          5,411       5,616       5,763        -205        -147
Outside China :          5,415       5,625       5,772        -210        -147
The U. S. A.  :            583         607         633         -24         -26
-
               INFECTION LEVEL
                     OF ENTIRE                              CHANGE      CHANGE
                      POPULACE                                  ON          ON
ENTITY                   04/15       04/14       04/13       04/14       04/13
-
Globally      :       00.0177%    00.0170%    00.0166%    00.0007%    00.0004%
Outside China :       00.0224%    00.0216%    00.0211%    00.0008%    00.0005%
The U. S. A.  :       00.1713%    00.1648%    00.1580%    00.0065%    00.0068%
Hopefully within a week or so, we'll begin to see a better direction here.
I was pretty sure things looked better the day before, but yesterday's
numbers don't look so swell. Even so that rate of infection rate for the U. S.
slowed, even with the big numbers.
Daily Case Report Evaluation
I'll be keeping tabs on the daily tallies for days of the week for a while. Folks have
noticed some patterns of larger and smaller data entry on certaind days, and on Fridays
sometimes the numbers get noticably larger because of it.
Let's check out the numbers and a chart.
Wk/of      Tue      Wed      Thu      Fri      Sat      Sun      Mon
-
03/06    2,223    2,265    2,962    3,801    3,977    3,876    4,411
03/13    4,411    4,680    2,085   17,028   11,031   13,847   12,158
03/20   15,748   20,668   25,700   30,911   31,846   31,979   42,362
03/27   41,500   48,988   60,679   65,282   67,094   58,576   62,551
04/03   73,890   77,602   78,618  102,520   85,002   71,933   72,328
04/10   72,328   87,578   83,407   96,134   78,647   73,300   70,403
04/17   74,620   90,108

Friday's do seem to have a bias in favor of larger reports of new cases.
I'll keep tracking this for at least a few more weeks to give folks a chance to detect
patterns not only on Fridays, but other days as well.
States of the Union and the District of Columbia, Alphabetical & by Case Number
Idea of adding more informaton here, courtesy of Presbyterian Reporter
This little report now provides the number of cases and the deaths. I was going
to add more, but the data set I needed to pull this from, didn't provide that
information.. It's an alphabetical and cases by declining number file.
It will also be available as a downloadable Excel file, so you can do your own
sorting, beyond the two sorts I have provided here. Both the states and the counties
come on one Excell spreadsheet.

Here is the Standing of 200 Counties in the U. S.
This little report lists 200 Counties in the United States in declining Case numbers.
There is also a listing that is alphabetical. This report just list the entities
and the number of Cases in the two different sorts.
It will also be available as a downloadable Excel file, so you can do your own
sorting, beyond the two sorts I have provided here. The States and Counties are
included on the same Excel spreadsheet.

Here's what it's all about. From January 20th to the present.

This concludes our look back at yesterday's data. Take care...

Data for this Report Sourced From:
LINK Johns Hopkins University
The Center for Systems Science and Engineering (CSSE)
LINK WorldoMeters
LINK You are Invited to Review My COVID-19 Spreadsheet (XLSX)
There is not an XLS version available for distribution at this time.
Other Features:
LINK US States DC51, Territories5+, and Counties200
Excel Spreadsheet with Alphabetical and Numerically descending Cases
Links to other resources:
I cannot vouch for these sites. Please use your own discression.
LINK Adventist Health Coronavirus Resource Hub - Scroll down for useful info
LINK CDC Data for Download - Scroll down - Excel required. Includes death stats.
LINK CDC Secondary Data and Statistics - Portal Entry / Look around
LINK Coronavirus (COVID-19) Map
LINK COVID-19 First U.S. Case, Treatment, features Remdesivir
New England Journal of Medicine article
LINK On the Origin of CCP Virus, A Documentary Movie (turn up the sound)
Epoch Times: I highly recommend this very well documented report.
LINK Diamond Princess Review at 634 Case Point of Eventual 712
LINK earlyAlert
LINK Hydroxychloroquine Article: International Poll
Daily Mail Reports, Most Effective Treatment According to 6,000 Physicians
LINK IHME - Institute for Health Matrix and Evaluation
LINK National Institutes of Health - Cornavirus (COVID-19)
LINK New York City - interesting breakdown, burough, age, sex
LINK World Health Organization

Please place me on the list.
Thanks.
Will refund checks have your name on it? TY.
Oh yes, and your refund will be delayed while we hash that out.
d":^)
That’s a lot of work right there! Have my hands plenty full just tracking my state and county........
On Wednesday April 1 I began tracking the number of ‘serious, critical’ cases being reported in the USA.
These are the people who may likely die in the next few days.
If the ‘serious, critical’ number goes up, we will likely see more deaths. On the other hand if the various drugs being tested are effective in treating the virus, the ‘serious, critical’ number should go down.
Here are the numbers:
Apr 1 Wed 5005
Apr 2 Thu 5421
Apr 3 Fri 5787
Apr 4 Sat 8206
Apr 5 Sun 8702
Apr 6 Mon 8879
Apr 7 Tue 9169
Apr 8 Wed 9279
Apr 9 Thu 10,011
Apr 10 Fri 10916
Apr 11 Sat 11471
Apr 12 Sun 11766
Apr 13 Mon 12722
Apr 14 Tue 13473
Apr 15 Wed 13487
Yesterday, the number of serious and critical cases only increased by 14 patients. While that is great news, we need to keep in mind that 2482 people died yesterday.
What we need to see is a slowdown in the number of people who are serious/critical and a slowdown in the number of people dying.
Got a question. Are your numbers cumulative for each day or are they incremental? I guessing cumulative. Right?
A FReeper suggested that Finlanders use sauna’s more than any other Nordic country & that it could be an explanation for fewer cases there. I have no idea if that’s true, but we know viruses don’t like heat, so maybe it’s having an effect?
Much recently has been said about the bumping up of fatality numbers encouraged by the CDC with NYC bumping theirs up by some 3000. would that account for some of the recent data trends/are they factored into the data you draw upon?
Wilhem went to the “General Westmoreland School” of counting bodies.
Why was a Chinese scientist stripped of security clearance?
Harvard professor among three charged with lying about Chinese government ties LINK
What were the professor's ties to Wuhan lab?
Expert: Chinese Scientists Sell Lab Animals as Meat on the Black Market LINK
Selling a lie? The outbreak caused by bat soup?
Steven Mosher: ‘Most Likely Explanation’ for Coronavirus Is Wuhan Bioweapons Lab LINK
Meaning it was created in a lab and weaponized. Why?
Stock Markets Retreat As Nervous Investors Pocket Week's Gains LINK
Follow the money, who's waiting in the wings to profit (As early as January 26th)?
Bill & Melinda Gates Foundation Commits $10 Million to Global Response to 2019-nCOV LINK
Bill Gates Predicted Coronavirus-Like Outbreak in 2019 Netflix Documentary LINK
There has been theories that the Wuhan Bio-lab was funded by George Soros
Jeremy Corbyn's brother Piers claims Bill Gates and George Soros are behind coronavirus in bid to cull world's population with poisoned antidote in bizarre conspiracy theory LINK
Could that be disinfo to cover the real reasons? Just a motive of tanking global economies and install global governance, or simply to take down a president and return to "business as usual" with DUmocrat puppets? A 2015 documentary from Italia RAI (Italian national public broadcaster) covers a Chinese Lab that's engineering of a new virus combining Coronavirus from bats with SARS LINK
The Lab Experiment of BAT WOMAN LINK
Did she get a case of ARKANCIDE?
The DELIVERY SYSTEM LINK
DEEP STATE strikes back?
Fauci: There will be a surprise outbreak (2017) LINK
Who will PROFIT from chaos?
Bill Gates calls for nationwide social isolation policy to slow virus LINK
So, Bill Gates and George Soros both tag-team to fund a Wuhan bat virus study while combining it to infect humans, then create an "antidote" to sell to solve the problem that they themselves created.
Bill Gates Calls For National Tracking System For Coronavirus During Reddit AMA
Bill Gates has got a secret!LINK
Bill Gates Calls For National Tracking System For Coronavirus During Reddit AMA LINK
Bill Gates: Coronavirus Means We Need ‘Digital Certificates’ To Prove Who Received Vaccine LINK
Can I offer you a new tattoo?
Bill Gates, MIT Develop New ‘Tattoo ID’ to Check For Vaccinations LINK
The DELIVERY SYSTEM
The Laptop
The Lugi
The ELEVATOR
Door Handles
Chinese Checkers
Air Mail
“No more for Americans!”
In reviewing a few of the cultural differences it seems to me that Finland is: a) a slightly different ethnic makeup (the Russia and indigenous connection) and, b) they are more rural and c) from all I have read they seem prone to slightly less social connection to one another and perhaps slightly less outgoing -- except for immediate family (I'm comparing that to the outgoing nature of the U.S. and perhaps Sweden).
I believe those differences may offer a clue to the difference in the death rate between the two.
Otherwise, see the chart below for a few metrics.
In my opinion, Sweden did it right! Why the rest of the world did not follow that pattern is something I'm sure will stir debate for a long time. By the way, Sweden was not the only country. I'll save that for another day/
Your insight?
click on image to enlarge
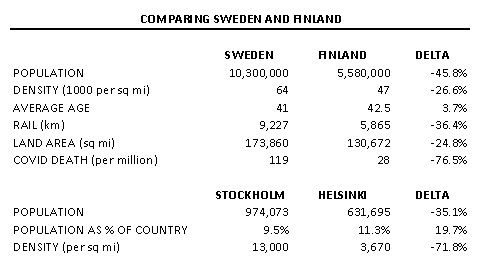
cumulative as reported on worldomater
Top 4 largest cities in Sweden (metropolitan area)
Stockholm – 1,515,017
Gothenburg – 599,011
Malmö – 316,588
Uppsala – 160,462
Top 4 largest cities in Finland (metropolitan area)
Helsinki 1,176,976
Tampere 317,316
Turku 254,671
Oulu 188,279
The DEMOCRATS are the leader in 24 states and the District of Columbia.
There are 485,074 cases and 23,443 deaths in those 25 states and DC.
The REPUBLICANS are the leader in 26 states.
There are 152,345 cases and 4,999 deaths in those 26 states.
Where do you feel safer?
I believe it impacted today on the 16th.
Deaths in the U. S. are over 6,100 today.
Something smells awfully fishy about new classifications
in the neighborhood of 3,700 deaths.
Disclaimer: Opinions posted on Free Republic are those of the individual posters and do not necessarily represent the opinion of Free Republic or its management. All materials posted herein are protected by copyright law and the exemption for fair use of copyrighted works.