Posted on 04/05/2020 4:20:18 PM PDT by daniel1212
A lack of adequate testing means many of those who have been infected with the coronavirus will not appear in official statistics. This suggests that many estimates for its mortality rate are much too high...
Public health epidemiology is the science of counting to prevent disease and promote health. We count the number of new cases of a particular disease; this is the incidence. Then we count how much a disease has spread in a population; this is the prevalence.
When it comes to COVID-19, counting is a challenge. Despite all the news articles and reports, we know very little about the incidence or prevalence of this new disease. And as is always the case: ignorance breeds fear. In my hometown of New York City and elsewhere one fear is on just about everyone’s mind: death rates here appear to be considerably higher than rates reported elsewhere.
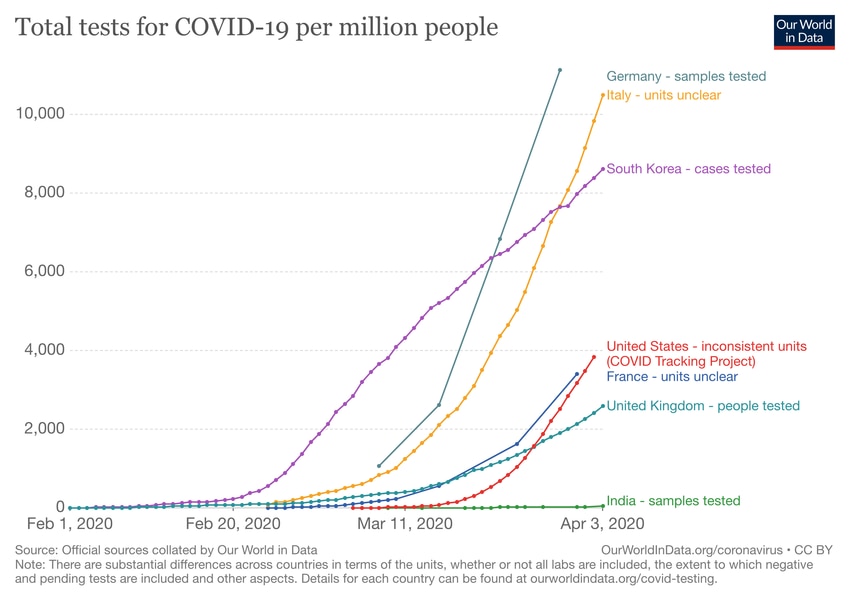
Or are they? Using patient data from China, public health officials initially estimated that 80% of COVID-19 cases are either asymptomatic or have mild disease. Given that hospital beds, health workers, and test kits are in short supply, only highly symptomatic people are advised to go to the hospital. Because of lack of adequate testing, including in the United States, in many places only hospital patients are now counted as cases. The people who do not feel seriously ill stay home, recover quietly, and are never counted. This matters because they do not appear in any of the official statistics.
Take for example an elderly New Yorker who is mildly sick. She calls her family doctor who makes a clinical diagnosis of suspected COVID-19 based on her symptoms, not a test. Because she is not very sick, she is advised to stay home. There is no mechanism for her doctor to report her diagnosis to the health authorities, so if she gets better, she is never counted. Only if she becomes ill enough to be admitted to the hospital, is she counted as a COVID-19 case. If she dies she will be counted as a COVID-19 death.
Since many of us are experiencing homeschooling these days, it seems a good time for a math refresher. Once the number of infections is determined, this becomes the denominator in our public health calculation. The number of deaths is our numerator.
Numerator (number of deaths)/denominator (number of people infected) x 100 = infection fatality rate
We know the virus spreads very fast once it is introduced to a population. That means many of us in the general population are or were already infected with the virus- whether or not we have symptoms.
However, instead of counting us all in the denominator, in many countries including the US, only people sick enough to go to the hospital are counted. People sick enough to go to the hospital are more likely to need critical care, and patients in critical condition are more likely to die than patients with mild symptoms. This means the fatality rate looks higher than it really is.
Further, even when we are testing, depending on the type of test used, we may only be counting people who are actively infected, not those who had it and are thus currently immune. This again will lead to an underestimate of the denominator...
The vast majority of us will be infected, survive, and remain unware if we carried the virus or were contagious, so we will unwittingly infect our friends and family members.
Data from across the US and from other countries about deaths by age, underlying medical conditions, medications being taken at time of death, and other factors could eventually help us understand how COVID-19 behaves at both a population and individual level. In the meantime, we need to adjust official population-level estimate of case numbers, or at the very least, build better systems for sharing data and reporting.
And at some point, we will return to and rebuild our daily routines, with the new addition of attending to the mental health crisis caused by weeks of fear, isolation and anxiety. Much of which could have been avoided by an accurate and clear definition of the denominator.
Anna Matterson, Susanna Lehtimaki and Katie Holland also contributed to this piece.
Wow, shocked, shocked I tell ya.
bookmarked
PPE any less scarce?
Is the one-day death count (yesterday) THREE TIMES that of any one-day flu death count everyone's imagination?
Ya think?
How many hospitals are crushed? As a percentage it probably rounds off to ZERO bring crushed. The biggest problem facing most hospitals is layoffs.
PPE is scarce but since it has been restricted to hospitals and medical workers it has no bearing on going back to work. its a free country most people are ready to go with out it.
Read the article to understand the irrelevance of the death count. 3,000,000 souls pass every year in this country. How concerned are you about those one-day death counts.
This year even if 200,000 die due to chinese Wuflu the stats look this:
2020 US death stats = This year 200,000 people died due to Chinese WuFlu while 2,800,00 died of something else.
WEC is normally a very Left-leaning group. They’re just finally admitting that deaths primarily caused by COVID-19 are actually quite low.
I am not a statistician, maybe someone who is can explain. But according to the worldometers site, we have conducted over 1.7 million tests but only identified 366,000 cases. It seems to me if there were that many more people infected that number would be higher. But then if you compare New York and New Jersey to California, both New York and New Jersey are running around a third of their tests coming back positive where as California has done I think 113,000 tests and only a identified 14,000 cases. I certainly think California’s numbers support the idea the virus has already already run its course. California also has a dearth ratio of 9 per million.
someone needs to tell donald. This is way past over baked
bs numbers in bs numbers out
This is using a death rate = deaths / total cases * 100%, which gives a low number.
People who get sick, are going to recover or die.
World meters is using a death rate = deaths /( deaths + recoveries ) * 100%, which gives a scary number.
Making this harder is that many who die already have health issues, and that number of undiagonsed cases is anyone's guess. It's easier to be a Monday morning quarterback, than being the quarterback who has to make the call.
A valid question based upon some claims I am seeing, but shortage is not simply because of CV, but the flu which you seem to want to marginalize:
After Steady Decline, Influenza Activity Rising Again in US The overall cumulative hospitalization rate for the season rose from 65.1 to 67.3 per 100,000 population. Hospitalization rates are "higher than most recent seasons," and rates for children aged 0 to 4 years (93.9 per 100,000) and adults aged 18 to 49 years (35.2 per 100,000) are at their highest since the CDC began recording these figures ― higher even than during the 2009 H1N1 pandemic.
Hospitalization rates for children aged 5 to 17 years (24.4 per 100,000) exceed those from "any recent regular season but remain lower than rates experienced by this age group during the pandemic," the CDC explains.
Hospitalization rates were 88.9 per 100,000 population for adults aged 50 to 64 years and 176.8 for adults aged 65 years or older. - https://www.medscape.com/viewarticle/927904
PPE any less scarce?
Why was it? And again PPE is used for the flu also. Meanwhile about half the people I saw yesterday morning in this low income city had masks on. And 1 hour ago - India News: The health ministry on Sunday said shortage of personal protective equipment (PPEs) and N95 masks was easing with supplies being received.. - https://timesofindia.indiatimes.com/india/shortage-of-ppe-masks-easing-says-govt/articleshow/75000703.cms
Is the one-day death count (yesterday) THREE TIMES that of any one-day flu death count everyone's imagination?
You mean more than the average 100 per day from motor vehicle accidents in 2018? Garage-in place. How do we know there is not co-infection (it can occur) going on, and with CV being blamed for death? And
During the 2017-2018 flu season the the % of deaths attributed to pneumonia and influenza (P&I) was at or above the epidemic threshold for 16 consecutive weeks., and exceeded 10.0% for four consecutive weeks, with older Americans dying at a rate of 169 Americans a day, or seven people per hour.
But those who die are almost always going to be those who went to the hospital or at least are tested for the cause of death. .
World meters is using a death rate = deaths /( deaths + recoveries ) * 100%, which gives a scary number.
But who identifies to the tabulators as having recovered? The perhaps 50% who do not know they had it, and or who recover as with a cold? Add them to World o meters recovery number, if you can estimate them.
Each year, in the USA, just 1 million to 2 million people are tested for influenza.
A majority of them are “at-risk” - which means they have known exposure (like health care workers or family members), or they traveled to a region with a high influenza rate, or they have obvious symptoms.
At the end of a calendar year or an influenza season, it takes about six months of data collation and mathematical modeling to ESTIMATE an infection rate range.
Then, it takes another six months of mathematical modeling to ESTIMATE what the best influenza ESTIMATE is!
We should not be surprised at the apparent chaos involved with trying to measure a completely “novel” virus like COVID-19.
The CDC and the various sub-units of the CDC are completely responsible for these procedures and these decisions.
Thank Dr. Fauci for the chaotic testing and chaotic interpretations.
More than 1 million Americans have died from influenza during Fauci’s 36 year “watch” - but, apparently, he is still considered to be a “medical hero” by the popular press.
What we do not know if what kind of test is used, and if the subjects are tested for both the flu and CV, and what determines how the cause of death is assigned. If a patient dying of cancer tests positive for CV and dies, the cause is listed as what? In Italy it was said be liberally assigned to CV.
And what you do not see headlined is that,
Laboratory confirmed influenza-associated hospitalization rates for the U.S. population overall are higher than most recent seasons and rates for children 0-4 years and adults 18-49 years are the highest CDC has on record for these age groups, surpassing rates reported during the 2009 H1N1 pandemic. Hospitalization rates for school-aged children (5-17 years) are higher than any recent regular season but remain lower than rates experienced by this age group during the pandemic.
The percent of deaths associated with pneumonia and influenza is above the epidemic threshold. The increase is due to an increase in pneumonia deaths rather than influenza deaths and may be associated with COVID-19.
However,
The percent of deaths associated with pneumonia and influenza is above the epidemic threshold. The increase is due to an increase in pneumonia deaths rather than influenza deaths and may be associated with COVID-19. - https://www.cdc.gov/flu/weekly/#S2
Atypical.
Yes, that is to be assumed, meanwhile after about 8 weeks of active tracking we had 8,000 deaths, which averages to be 1,000 a week. Which means that in order to reach the 200,000 death prediction that seemed to motivate the draconian response, this rate would have to continue for almost 4 years.
COVID-19 is likely taking people who were going to die anyway at some point this year and compressing those deaths into the space of a few weeks. If deaths from all causes drop later this year you’ll have your answer.
I say go ahead and forecast a million deaths. Then when we come in far below that, we give Mike Pence the credit.
“Or are they? Using patient data from China, public health officials initially estimated that 80% of COVID-19 cases are either asymptomatic or have mild disease.”
Wow that means the death rate in Italy, 13%, or in France, 8%, could be as low as 3% or 2% - that would be a relief. So if I get this season’s flu (Covid19) I have only a 3% chance of death, instead of the usual .1% chance of death. It’s only 30 times worse, thank God!
https://www.worldometers.info/coronavirus/
Disclaimer: Opinions posted on Free Republic are those of the individual posters and do not necessarily represent the opinion of Free Republic or its management. All materials posted herein are protected by copyright law and the exemption for fair use of copyrighted works.