Thanks to another Freeper I found the chart at the Financial Times. There is excellent information and charts over there. I'm impressed. But, for the most part, in my mind the chart posted here is useless. Here's why. Based on yesterdays data at Worldometer we had 378 cases per 1,000,000 souls. Compare us to Italy with 92,000 cases.. They stand at 1,541 cases per million. That is over four times our rate of cases. Something close to that ratio will hold pretty much across the world. I'm not sure we will get anywhere close to that number.I prefer to follow the gas_dr's numbers and hypothesis. That is, from the time the first 100 cases are reported the curve will flatten at between 15 and 25 days. That is based on China, South Korea and a few other countries. He focuses on the "exponential growth factor" or day over day change of new cases, which makes sense as a leading indicator.
In any event, see my tracking chart and data below. We seem to be moving in the right direction, if we don't get blown out of the water by another NY & NJ. So, maybe our target is 25 days to flatten the curve. Yesterday was day 19 by my count.
I believe it will happen.
Your thoughts and comments are welcome. No snarky, though.
IC Clearly
click on image to enlarge
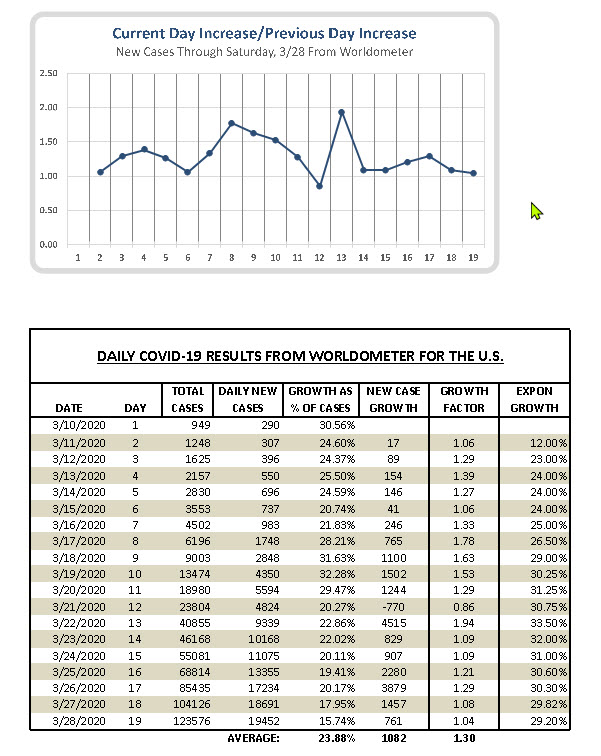
Data from Worldometer
I prefer to follow the gas_dr's numbers and hypothesis. That is, from the time the first 100 cases are reported the curve will flatten at between 15 and 25 days [based on China, South Korea and a few other countries]. There are a couple of things going on here. First, the FT data is not a projection or based on a model or an interpretation. It is just a chart of raw numbers and it is historical, e.g. past or present perfect tense.
gas_drs hypothesis is an hypothesis, not a fact. It is projection of what could happen. Further it is based on a speculation and not an explanatory mechanism so it has no more credibility than your opinion or my dog's opinion.
Further what is being loudly debated is the propriety and necessity of public health measures in this instance. Citing what happened in China or SK or some such is not an argument against because those trajectories are all based upon very vigorous and intrusive public health measures.
So I am no better informed by this than I was before.