To: grundle
OK.. What’s a scatterplot?
4 posted on
01/17/2015 6:28:44 AM PST by
Mamzelle
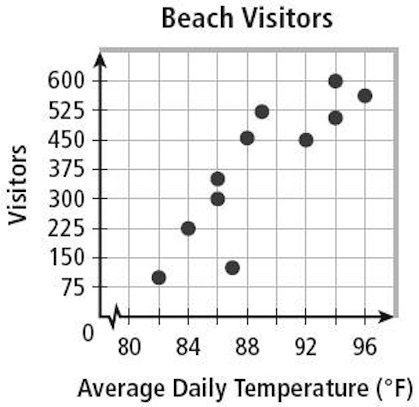
To: Mamzelle
A type of graph on which the information is shown as individual points rather than as a line, pie chart, or bar chart.
9 posted on
01/17/2015 6:39:44 AM PST by
Bob
(Violence in islam? That's not a bug; it's a feature.)
To: Mamzelle
To: Mamzelle
That’s the area around the litter box!
15 posted on
01/17/2015 6:44:56 AM PST by
SWAMPSNIPER
(The Second Amendment, a Matter of Fact, Not A Matter of Opinion)
To: Mamzelle
It’s basically an X-Y plot that shows how closely two sets of data are correlated (or not). If the plot shows a lot of scatter with the data points the less the data are correlated.
19 posted on
01/17/2015 6:47:54 AM PST by
halo66
To: Mamzelle
To: Mamzelle
Generally mathematical/statistical data points on a graph that might reveal trends based on concentration or direction of those points.
72 posted on
01/17/2015 9:45:01 AM PST by
xander
FreeRepublic.com is powered by software copyright 2000-2008 John Robinson