Posted on 08/12/2013 9:01:07 AM PDT by Kaslin
What's the real story for the overall trend in new jobless claims in the U.S.?
It has been several months since we last featured an update of our statistical analysis of the trends in new jobless claims in the U.S., which is mostly by design on our part.
When we last left off, the overall trend, which we identified as Trend L, was largely flat, but characterized by extreme volatility, with unusual outliers in the data popping up with an alarming frequency.
Some of that was understandable. We saw the state of California mishandle its processing of new jobless claims, causing their reported number to plummet one week, but soar in the next as the state caught up to their mistakes. We saw the impact of the "superstorm" Sandy, which caused claims in the northeastern part of the U.S. jump well above the trend, then slowly fall back toward it, then fall below it, before rebounding back to the otherwise flat trend level established early in the trend as that region of the country recovered from the event.
And then, several weeks after that, we started seeing volatility to the downside. The data would suddenly fall outside the statistically expected range for one or two weeks, but then be right back up in it the next.
That was more volatility than we wanted to have to keep addressing on weekly or biweekly basis, so we opted to let the data settle down on its own and pick up the pieces later.
And that brings us today, because it turns out that what was happening is that Trend L was breaking down and being replaced by a new trend, which we'll unimaginatively call "Trend M".
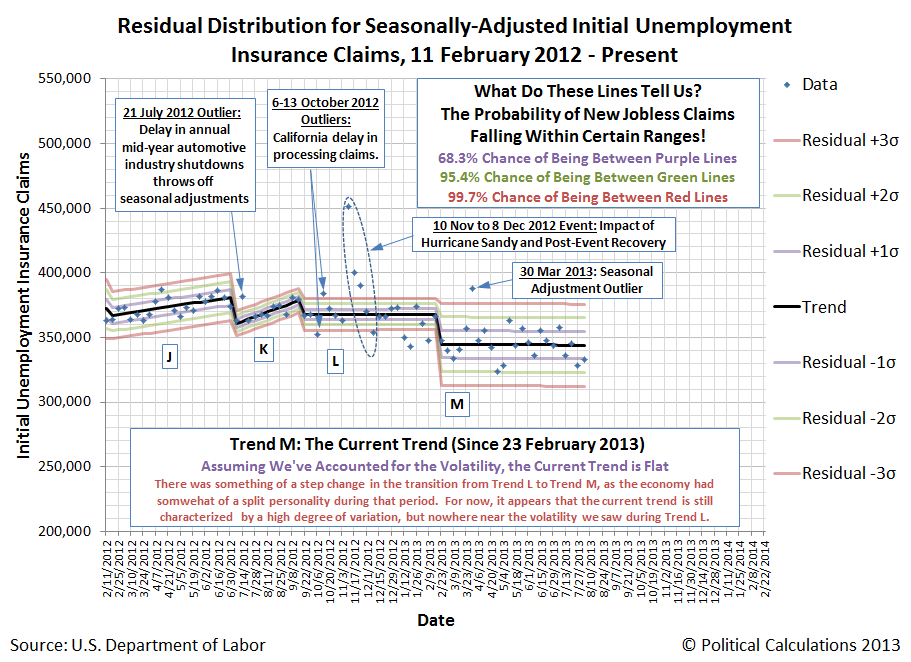
What appears to have happened is that the number of initial unemployment insurance claims being filed each week "stepped down" from the higher level defined by Trend L's mean level of 367,915 to a lower level defined by Trend M's mean level of 344,402.
Part of why we waited so long to discuss this shift is that we wanted to have enough data points to be able to describe the new trend that was establishing itself. Typically, it takes at least six to ten data points to do that, but the appearance of an outlier for the week ending 30 March 2013 led us to choose to hold off until we had at least 10 consecutive non-outlier data points. After that, it was just a matter of waiting for an opening in our schedule of posts.
Aside from the one outlier, which we recognize to be an artifact of the Department of Labor's recently revised seasonal adjustment factors for the week in question, Trend M has largely been flat since it established itself after 23 February 2013. While media reports have indicated that the trend is improving, that assessment is based on a four week moving average, which really capturing the data becoming less volatile. While that is an improvement, it hasn't affected the overall trend, which is largely just moving sideways.
Speaking of which, Trend M is characterized by a surprising amount of variation, which we typically have not seen in the data for our residual analysis, and which is the result of relatively wide swings in the data with respect to the general trend from week to week. We should also note that the current flat trend is still well elevated above the 317,000-318,000 new jobless claims filed on average each week in the years preceding the December 2007 recession.
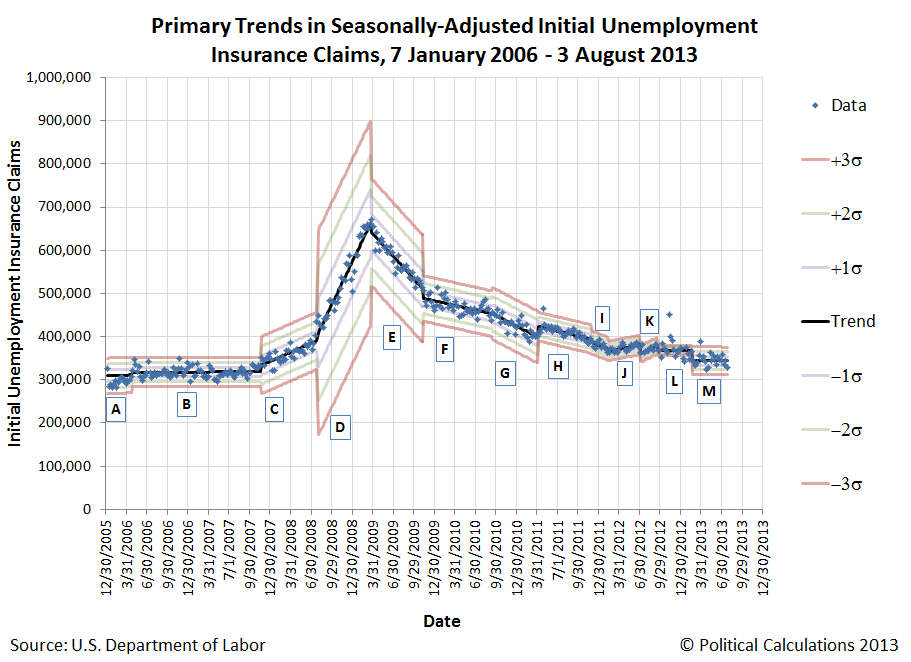
The following chart shows each of the primary trends that we have identified in new jobless claims since 7 January 2006.
The next chart shows the residual distribution of the trends in new jobless claims over the same period (the first chart in this post focuses on the most recent trends identified in this chart.
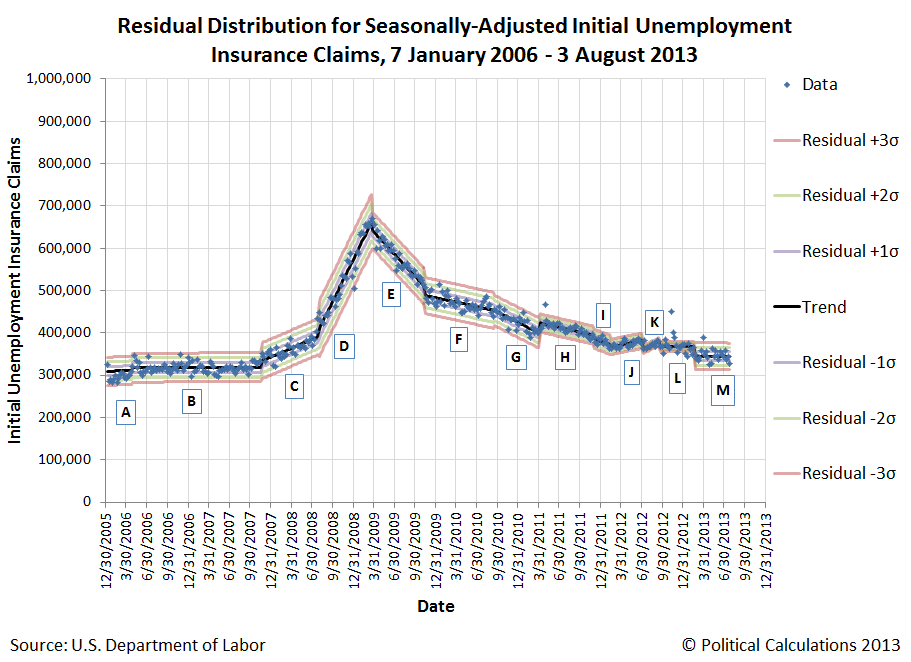
Finally, since we've marked the formation of a new trend, we've updated our table describing each of the ones we've covered since 2006, along with more discussion of our thoughts on what's driving them:
| Timing and Events of Major Shifts in Layoffs of U.S. Employees | ||||||
|---|---|---|---|---|---|---|
| Period |
|
Starting Date |
|
Ending Date |
|
Likely Event(s) Triggering New Trend (Occurs 2 to 3 Weeks Prior to New Trend Taking Effect) |
| A |
|
7 January 2006 |
|
22 April 2006 |
|
This period of time marks a short term event in which layoff activity briefly dipped as the U.S. housing bubble reached its peak. Builders kept their employees busy as they raced to "beat the clock" to capitalize on high housing demand and prices. |
| B |
|
29 April 2006 |
|
17 November 2007 |
|
The calm before the storm. U.S. layoff activity is remarkably stable as solid economic growth is recorded during this period, even though the housing and credit bubbles have begun their deflation phase. |
| C |
|
24 November 2007 |
|
26 July 2008 |
|
Federal Reserve acts to slash interest rates for the first time in 4 1/2 years as it begins to respond to the growing housing and credit crisis, which coincides with a spike in the TED spread. Negative change in future outlook for economy leads U.S. businesses to begin increasing the rate of layoffs on a small scale, as the beginning of a recession looms in the month ahead. |
| D |
|
2 August 2008 |
|
21 March 2009 |
|
Oil prices spike toward inflation-adjusted all-time highs (over $140 per barrel in 2008 U.S. dollars.) Negative change in future outlook for economy leads businesses to sharply accelerate the rate of employee layoffs. |
| E |
|
28 March 2009 |
|
7 November 2009 |
|
Stock market bottoms as future outlook for U.S. economy improves, as rate at which the U.S. economic situation is worsening stops increasing and begins to decelerate instead. U.S. businesses react to the positive change in their outlook by significantly slowing the pace of their layoffs, as the Chinese government announced how it would spend its massive economic stimulus effort, which stood to directly benefit U.S.-based exporters of capital goods and raw materials. By contrast, the U.S. stimulus effort that passed into law over a week earlier had no impact upon U.S. business employee retention decisions, as the measure was perceived to be excessively wasteful in generating new and sustainable economic activity. |
| F |
|
14 November 2009 |
|
11 September 2010 |
|
Introduction of HR 3962 (Affordable Health Care for America Act) derails improving picture for employees of U.S. businesses, as the measure (and corresponding legislation introduced in the U.S. Senate) is likely to increase the costs to businesses of retaining employees in the future. Employers react to the negative change in their business outlook by slowing the rate of improvement in layoff activity. |
| G |
|
18 September 2010 |
|
2 April 2011 |
|
Possible multiple causes. Political polling indicates Republican party could reasonably win both the U.S. House and Senate, preventing the Democratic party from being able to continue cramming unpopular and economically destructive legislation into law, bringing relief to distressed U.S. businesses. Fed Chairman Ben Bernanke announces Federal Reserve will act if economy worsens, potentially restoring some employer confidence. The White House announces there will be no big new stimulus plan, eliminating the possibility that more wasteful economic activity directed by the federal government would continue to crowd out the more effective economic activity of U.S. businesses. |
| H |
|
9 April 2011 |
|
26 November 2011 |
|
Rising oil and gasoline prices exceed the critical $3.50-$3.60 per gallon range (in 2011 U.S. dollars), forcing numerous small businesses to act to reduce staff to offset rising costs in order to prevent losses. The trend ends when average motor gasoline prices in the U.S. fall back below the $3.50 level in the week between 5 November 2011 and 12 November 2011 - the corresponding improvement in business outlook shows up in the data with the next full pay cycle (2-3 weeks later, or rather, the week ending 26 November 2011!) |
| I |
|
3 December 2011 |
|
11 February 2012 |
|
With average gasoline prices in the U.S. having fallen below the critical $3.50 per gallon level, employers respond to the improving business outlook by reducing the number weekly layoffs at a faster rate, as both businesses and consumers benefit from lower transportation and fuel costs, while consumers gain more disposable income. Trend I ended shortly after gasoline prices rose back above the $3.50 per gallon mark in late January 2012. |
| J |
|
18 February 2012 |
|
23 June 2012 |
|
With average gasoline prices continuing to be a high levels through the spring and summer, the pace of layoffs in the U.S. steadily increased until June 2012, when the national average price of gasoline in the U.S. finally dropped back below the $3.50 per gallon mark. |
| K |
|
30 June 2012 |
|
15 September 2012 |
|
Trend K began with a sudden shift downward in the number of new jobless claims as gasoline prices fell below the $3.50 per gallon mark in June 2012, and although the average price of gasoline in the U.S. has since risen back above that level, there has been no sudden upward shift in new jobless claims. Instead, the number of initial unemployment insurance benefit claim filings has been rising at a faster rate than at any time since on the onset of the 2007 recession. |
| L |
|
23 September 2012 |
|
16 February 2013 |
|
A surging housing market beginning in July 2012 followed by the Fed's action to aim its QE efforts directly at the industry on 13 September 2012 helped averted a developing recession in the U.S. at the end of 2012 as it stabilized the number of new jobless claims filed each week. Still, Trend L was characterized by a having a tremendous number of outliers as compared to previous trends, primarily due to the impact of Hurricane Sandy. |
| M |
|
23 February 2013 |
|
Present |
|
Trend M began with a sudden shift downward in the number of new jobless claims beginning in mid-January 2013, which became a definitive shift by mid-February. With gasoline prices elevated at the time, our thinking is that other factors, such as the Fed's amping up QE 4.0 on 12 December 2012 to offset the negative effects of tax hikes they believed would take effect in 2013, are responsible for the downward shift in the number of claims. Here, we think the Fed's monetary policy succeeded in offsetting the fiscal drag from the tax hikes that did take effect in 2013, which is a good thing because the alternative would have been the onset of a full-bore recession, where we would be watching the trend in new jobless claims rise instead. |
Noise and more noise. I’ll say it again, the only number that matters is the Labor Force Participation Rate, which for twenty months or more has been doing nothing but limping along at 30-year lows.
One thing I hate more than math is statistics.
You always have such important wubjects
would you mind condensing the importance of this?
I am like most and get lost in stats
Subjects
no wubjects
geesh
You always have such important wubjects
would you mind condensing the importance of this?
I am like most and get lost in stats
What total crap. There are lies, Damned lies, and then there are statistics.
At the end of this crock of BS is the conclusion that the Fed’s monetary policy was beneficial because jobless claims have receded somewhat.
The primary source of new jobs in this economy were created by the oil industry in a few states. These jobs were due to the new FRACKING going on which the Obamatrons TRIED TO KILL. 95% of all new jobs are PART TIME and LOW WAGE. Our earning power has not been so low since the GREAT DEPRESSION.
Let’s not confuse Time Series analysis (say four-term sinusoidal forecasting or exponential smoothing models) with Six Sigma models, particularly when the Central Limit Theorem does not apply.
The article is only about the mechanics and charting of "...the number of initial unemployment insurance claims being filed each week..." These statistics are of limited to no use for those trying to understand the trouble this country is in.
What we need are charts showing Labor Force Participation or conversely, Labor Force Unemployment for the entire history of our country. And those rates must be calculated simply, not with all of the smoke and mirrors the government is using.
"Simply" means, total labor force versus total employed or total unemployed. Anything else is either meaningless or of narrow focus.
I expect that calculating "simply" will show we not only remain in recession but are very close to Great Depression numbers.
I knew what you meant
Exactly. The press expends a lot of ink discussing little blips in the supposed unemployment rate as it zig-zags from 8.1 to 7.9 as if its some kind of great improvement in the economy. When, since these people do not return to the work force, it actually traces an economy corkscrewing into the tarmac.
The most important statistic, completely ignored by Big Media, is that the unemployment rate in November, 2006, when the Democrats were elected to take control of the House and the Senate, was 4.6%. This should be a talking point of every Republican running in 2014.
“Our earning power has not been so low since the GREAT DEPRESSION.”
////////////////////////////////////////////////////////////////////////////////////////////////////////////////////////////
I find it amazing that so many refuse to believe we are in a depression now and I think it is a far worse situation in many ways than we had in the thirties.
If it means anything, I kind of like wubjects.
Disclaimer: Opinions posted on Free Republic are those of the individual posters and do not necessarily represent the opinion of Free Republic or its management. All materials posted herein are protected by copyright law and the exemption for fair use of copyrighted works.