Skip to comments.
Tour the Country’s Energy Infrastructure Through A New Interactive Map
Energy Information Administration ^
| July 10, 2013
| Energy Information Administration
Posted on 07/11/2013 6:28:22 AM PDT by thackney
Every time you switch on a light, charge your electronics or heat your home in the winter, you’re relying upon a tremendous network of energy infrastructure that literally stretches across the country: power plants, pipelines, transmission wires and storage facilities.
It can be hard to visualize all this infrastructure and understand how it makes abundant energy available throughout the country. A map, though, can be a beautiful way of seeing a bigger picture—and a new map, released yesterday by the U.S. Energy Information Administration, combines a wide range of data (the locations of different types of power plants, electricity lines, natural gas pipelines, refineries, storage facilities and more) into an elegant, interactive interface that helps you understand how it all fits together. You can also zoom in on your own city or region to see the types of power plants generating electricity nearby.
The map also includes layers of real-time information on storm movement and risks, and the main intention of making all this data public is to allow utility officials and energy analysts to better understand the potential impact of storms, with hurricane season set to start. But simply playing around with the map can provide interesting insights about the state of our energy infrastructure today.
Here are a few of them, along with the percentage of U.S. electricity generation each power source currently provides:
Fossil Fuels Still Rule (Coal, 37%; Natural Gas, 30%; Petroleum, 1%)
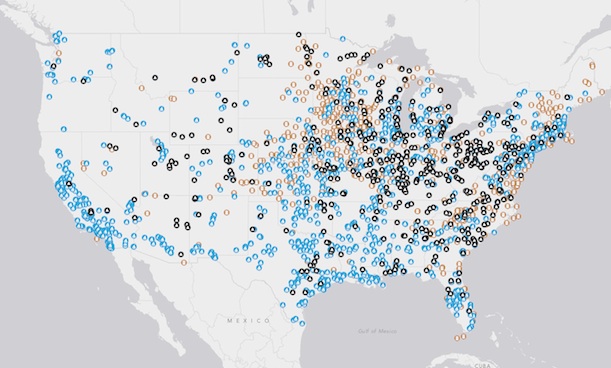
Our capacity to generate renewable energy has certainly grown in recent years, but looking at the map (and the data), one thing is clear: coal (black), natural gas (light blue) and oil-burning (tan) power plants are still the most plentiful forms of electricity generation we have. Coal plants are especially common east of the Mississippi—a relic of the fact that most U.S. coal was once mined in West Virginia, Pennsylvania and Kentucky (PDF), even though the majority now comes from Wyoming’s Powder River Basin. Oil and natural gas plants, meanwhile, are distributed pretty evenly among population centers across the country, with the former slightly more common in the North and East, and the latter a bit more common across the South.
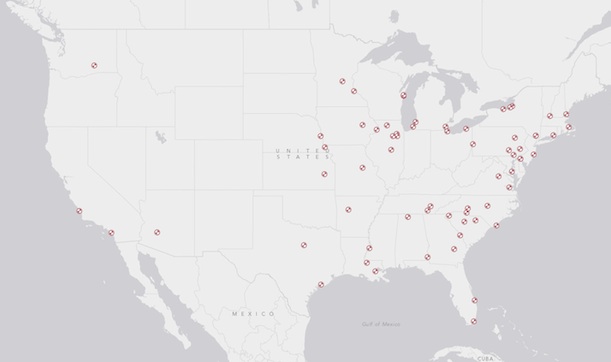
Nuclear Power Could be in Your Backyard (16%)
Although no new nuclear power reactors have been built since 1997, there are still 65 in operation nationally, and most are relatively close to large population centers. More than 16 million people live within 18 miles of one of these plants, the radius that Japanese officials evacuated after the 2011 Fukushima disaster. Despite the potential danger they might pose, though, nuclear plants provide far more electricity than any other non-fossil fuel option—and as a result, they reduce the amount of carbon dioxide emitted by our country as a whole.
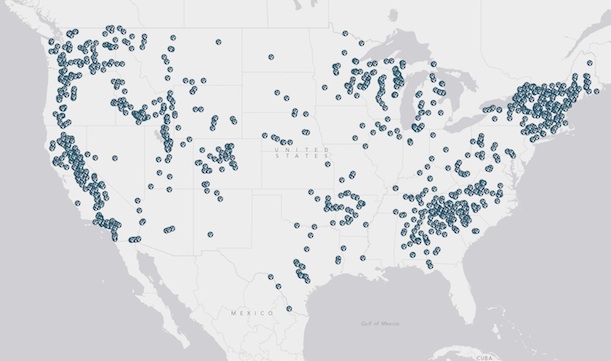
Hydroelectric is Crucial (7%)
Hydropower was among the first electricity technologies to be implemented on a wide scale—a power station situated on Niagara Falls began supplying electricity way back in 1881—and it’s still way ahead of the other renewable options. Hydroelectric plants are largely clustered in three areas: New England, the Middle South (partly as a result of the Depression-era Tennessee Valley Authority Project) and the West.
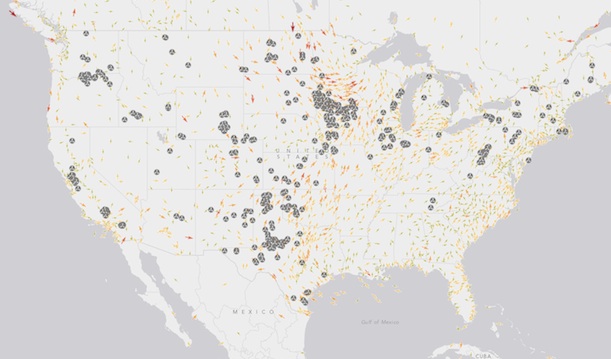
Wind is Growing (3.46%)
Of all new electricity capacity built from 2008 to 2012, 36.5 percent came from wind, and it shows: Turbines can now be found in most regions of the country with sufficient wind speeds. They’re especially prevalent in the Midwest, where consistent and strong winds blow across the plains year-round. In total, large-scale wind projects have been built in 39 states, with many more in the works. The map above shows turbines (grey) against a background displaying real-time wind speeds, with green arrows indicating slowest winds, then orange showing middle speeds and red showing fastest.
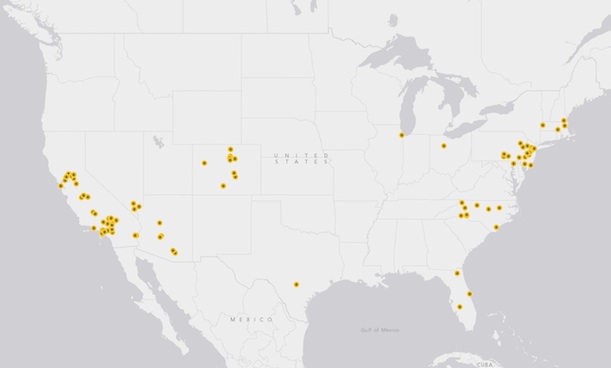
Solar is Slower (0.11%)
Compared to wind, another main source of renewable energy—solar power—has grown at a considerably slower rate, mostly because it’s much more expensive. Still, though, several major projects have been built, including the Agua Caliente Solar Project in Arizona, which produces more photovoltaic energy than any other plant globally, and the Solar Energy Generating Systems in California’s Mojave Desert, which is the largest solar thermal energy project (generating electricity by harnessing solar power to produce heat) in the world.
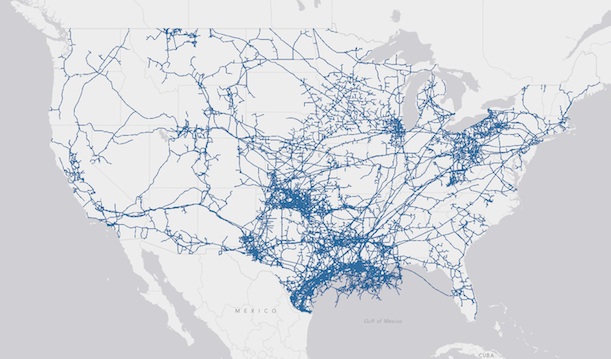
There is a Ton of Natural Gas Pipeline
It’s hard to truly appreciate how much natural gas pipeline has been laid in this country until you look at the map and see for yourself. To put it in perspective, there are more than 305,000 miles of pipeline nationally, as compared to about 47,000 miles of interstate highway.
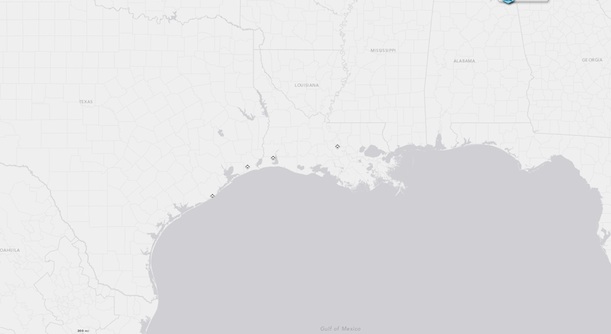
The Strategic Petroleum Reserve is a Real Place
When it’s discussed in the news, the Strategic Petroleum Reserve is mainly discussed in the abstract, an emergency supply of oil that we can use if our supply were to be disrupted. As a result, many people imagine it as a distributed, perhaps even hypothetical entity. Not true: This supply of nearly 700 million barrels of petroleum is held in four particular storage locations in Louisiana and Texas, near many of the refineries where it’s made from crude oil.
Of course, these are far from the only insights to be gained from tinkering with the map, packed with more than 20 layers of data on everything from geothermal power to offshore oil platforms to electricity transmission lines. Play around with the map yourself, turning on and off layers of data, and drop us a comment with your most interesting insights below.
TOPICS: Business/Economy
KEYWORDS: electricity; energy; naturalgas; oil
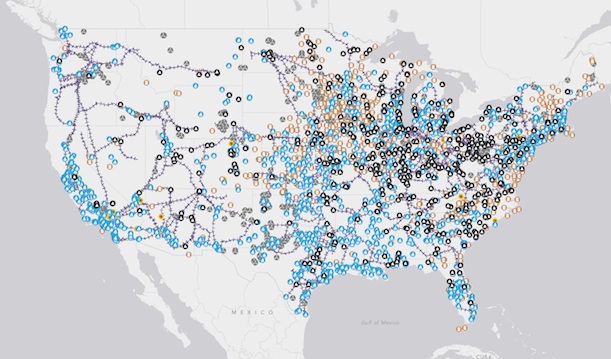
A new mapping tool shows the locations of power plants, transmission wires, pipelines and all things energy. On the image above, black circles are coal power plants, light blue are natural gas, tan are petroleum, yellow are solar, grey are wind and purple hashed lines are interstate power lines. All images via U.S. Energy Information Administration
Fossil Fuels Still Rule (Coal, 37%; Natural Gas, 30%; Petroleum, 1%)
Nuclear Power Could be in Your Backyard (16%)
Hydroelectric is Crucial (7%)
Wind is Growing (3.46%)
Solar is Slower (0.11%)
There is a Ton of Natural Gas Pipeline
The Strategic Petroleum Reserve is a Real Place
![]()
ENERGY DISRUPTIONS
Energy Infrastructure with Real-time Storm Information
http://www.eia.gov/special/disruptions/
1
posted on
07/11/2013 6:28:22 AM PDT
by
thackney
To: thackney
This is probably the stupidest thing you can ever do in today’s age of terrorist attacks. Our government gets stupider and stupider with each passing second.
2
posted on
07/11/2013 6:36:55 AM PDT
by
Patriot95
To: thackney
3
posted on
07/11/2013 6:36:56 AM PDT
by
TexasCajun
(Creepy-Ass Cracker)
To: thackney
Was it really a good idea to make all these maps public?
I mean... wow. HERE YA GO, terrorist!
Here’s where they’re at
4
posted on
07/11/2013 6:40:04 AM PDT
by
SomeCallMeTim
( The best minds are not in government. If any were, business would hire them f)
To: thackney
Mohammed wants to thank the energy department for their help.........good morning NSA.
5
posted on
07/11/2013 6:41:24 AM PDT
by
Datom
(Still runnin' "Against the Wind.")
To: SomeCallMeTim; Patriot95
Any terrorist that couldn’t figure this out before, at the broad level of detail shown here, isn’t any concern.
This isn’t new public information, it is the same “already public” info gathered together for the purpose of adding storm information to it. It assists in disaster planning as well as those in business.
6
posted on
07/11/2013 6:44:29 AM PDT
by
thackney
(life is fragile, handle with prayer)
To: Patriot95
Un freekin’ believable! This amounts to outright treason. And they are up in arms about the guy in the Moscow airport. Pogo was right!
7
posted on
07/11/2013 6:46:22 AM PDT
by
Don Corleone
("Oil the gun..eat the cannoli. Take it to the Mattress.")
To: Datom; Don Corleone
Every bit of this data was already available one line at the same source and has been for many, many years.
This isn’t new public data. This is only gathered together to overlay with storm information for disaster planning.
8
posted on
07/11/2013 6:49:47 AM PDT
by
thackney
(life is fragile, handle with prayer)
To: Patriot95
These maps have been available for small change since the 1960s. Some are free with a subscription to oil trade magazines.
To: Datom
If Mohammed was smart, he’d try Google Earth first.
10
posted on
07/11/2013 6:55:57 AM PDT
by
1rudeboy
To: thackney
11
posted on
07/11/2013 7:01:13 AM PDT
by
Datom
(Still runnin' "Against the Wind.")
To: 1rudeboy; Eric in the Ozarks
If some people thought they were same with the same information available for free at a thousand different sites already, I’m glad I removed the scales from their eyes with 1,001.
Heck, need to find a nearby refinery or power plant? 5 decades ago I would just use a phone book. I can see several out my office window. Who really believed these were hidden?
12
posted on
07/11/2013 7:02:35 AM PDT
by
thackney
(life is fragile, handle with prayer)
...thought they were
same same with the same information...
sigh....
13
posted on
07/11/2013 7:09:43 AM PDT
by
thackney
(life is fragile, handle with prayer)
...thought they were
same safe with the same information...
double sigh....
14
posted on
07/11/2013 7:10:13 AM PDT
by
thackney
(life is fragile, handle with prayer)
To: thackney
15
posted on
07/11/2013 7:12:50 AM PDT
by
1rudeboy
To: thackney
16
posted on
07/11/2013 8:10:18 AM PDT
by
IronJack
(=)
Disclaimer:
Opinions posted on Free Republic are those of the individual
posters and do not necessarily represent the opinion of Free Republic or its
management. All materials posted herein are protected by copyright law and the
exemption for fair use of copyrighted works.
FreeRepublic.com is powered by software copyright 2000-2008 John Robinson
