Posted on 10/27/2011 9:27:46 AM PDT by Kaslin
Why is income inequality rising for U.S. families and households, but not for individual Americans?
Having now shown that there has been absolutely no significant change in the level of inequality among U.S. individual income earners from 1994 through 2010, we thought we'd take a step back and look at the data for U.S. families and for households to examine those trends over time.
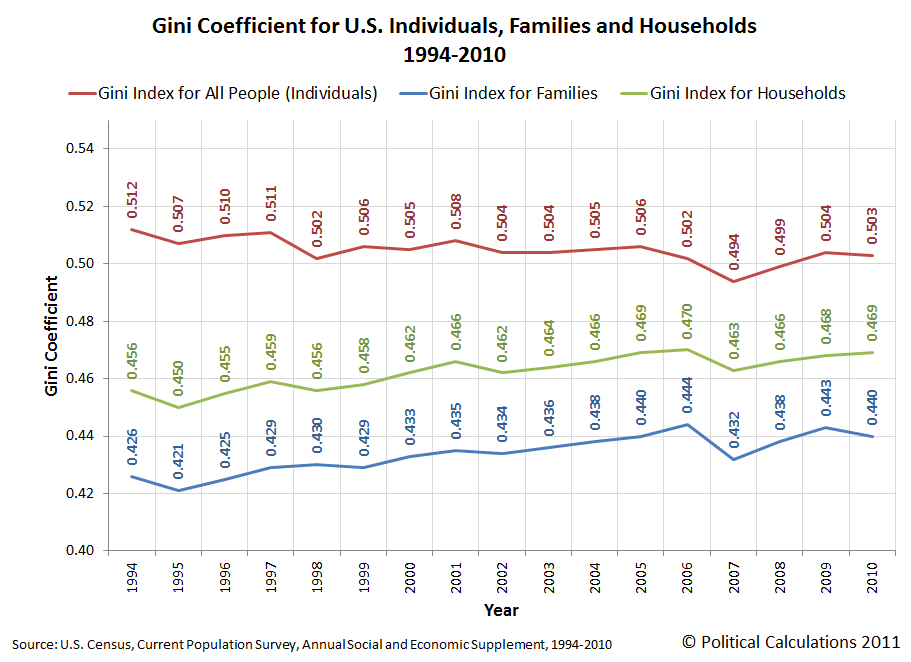
The chart below shows what we find for each grouping of Americans according to their Gini Coefficient, where a value of 0 indicates perfect equality (everyone has the same income) and a value of 1 indicates perfect inequality (one person has all the income, while everyone else has none):
In the chart above, we've adjusted the vertical scale to zoom in on the data, which magnifies the amount of any change from one data point to the next.
Starting with the topmost line on the chart, shown in red, which applies to all individual income earners in the United States, we see that this group contains the greatest degree of inequality by income, according to its Gini ratio. Here, there is no meaningful change in the amount of measured income inequality for the personal income distribution for the years from 1994 through 2010 (or if you really want to stretch, there has been a very slight decline in individual income inequality over that time - in our view, it is too slight to be meaningful as it may be the result of natural variation from year to year.)
The next line down, shown in green, applies to all households in the United States. Here we see that compared to U.S. individuals, U.S. households experience less income inequality. However, we see that there has been a slowly rising trend toward greater inequality from 1994 through 2010.
Meanwhile, the next line down, shown in blue, applies to all U.S. families. Here, we see the greatest amount of equality for incomes earned in the United States, and we also see that like the trend for U.S. households, there has been a slowly rising trend toward greater income inequality in the period from 1994 through 2010.
If that sounds familiar, that's because the income inequality data for both families and households has been what has typically been presented in a very biased media as evidence that the "rich are getting richer" over time, especially as these claims are being used by academics and activists to justify an ever-increasing amount of intervention by the government to combat this so-called "problem".
But here's the thing. We have already confirmed that there has been absolutely no meaningful change in the inequality of individual income earners in the years from 1994 through 2010. If income inequality in the U.S. was really driven by economic factors, this is where we would see it, because paychecks (or dividend checks, or checks for capital gains, etc.) are made out to individuals, not to families and not to households.
It would seem then that the real complaint of such people isn't about rising income inequality, but rather, how people choose to group themselves together into their families and households.
With a near rock-steady level of income inequality among individual income earners over time, it is only possible for income inequality to rise among families and households if the most successful income earners group themselves into families and households and if the least successful income earners likewise group themselves together into families and households as well. 
Think about it. The reason that the income inequality levels recorded for families and households are lower than those for individuals are because most families and households may have one high income earner, who is balanced out by individuals within the families or households who have low or no incomes.
But, if people with very high income earning potential join together to form families and households, and increasingly do so over time, perhaps because such people might have things in common that make forming themselves into families and households an attractive proposition, then income inequality among families and households will increase.
The same holds true for the opposite end of the income earning spectrum. If people with really low income earning potential join together to form families and households, or perhaps if they choose to split apart, and increasingly do so over time, then the resulting low income family and household will also make income inequality among families and households rise, even though there has been no real change in the amount of actual income inequality among individuals.
Now for the bigger picture. Ivan Kitov has done an extended analysis of the U.S. Census' income data back to 1947. He found the following related to the personal income distribution (PID) for the U.S. since 1960 (emphasis ours):
In fact, the Gini curve associated with the fine PIDs is a constant near 0.51 between 1960 and 2005 despite a significant increase in the GPI/GDP ratio and the portion of people with income during this period (see Figure 1). This is a crucial observation because of the famous discussion on the increasing inequality in the USA as presented by the Gini coefficient for households (US CB, 2000). Obviously, the increasing G for households reflects some changes in their composition, i.e. social processes, but not economic processes as defined by distribution of personal incomes.
In short, it's those social processes, which have driven demographic changes within U.S. households, that are almost exclusively behind the observed increase in family and household income inequality observed in the U.S. since the 1960s.
Surprisingly, many economists are still hypothesizing on what might be the cause of rising income inequality among families and households. From the discussion however, it's pretty clear that just about all of them may not be aware of the Gini coefficient data that applies to the personal, or individual, income distribution data that makes it possible to eliminate the proposed alternatives as serious contenders for explaining what we observe.
We hate to be the ones to tell you guys, but the econophysicists have solved this puzzle.
A: The is no “widening gap” between rich and poor.
B: Even if there were, who cares? There’s nothing wrong with inequality, as such. Often it means things are getting better. Try telling a kabillion Indians differently.
Burn the heretic!!
If this is only comparing income earners, isn’t it ignoring all the unemployed?
All the income earners that were employed and are now unemployed need to be included in the analysis.
Here's what has happened over the past 28 years:

Has the income for the top 1% gone up? Yes, the trend is upwards. But, notice the variability, and that 2007 was a peak year. After the Democrats took control of both houses of Congress, the economy crashed. 2008, 2009, and 2010 will be dismal, when those numbers are finally compiled.
And the share of national income varies as well:

The reason is that the top 1% gets a much larger portion of their income from capital gains. When the economy is good, they get more capital gains. When the economy is bad, they get less capital gains, or even capital losses.
In order to realize a capital gain, you have to invest money. A lot of it. And you have to risk losing some or all of it. If the top 1% stopped investing for capital gains, what would new or expanding businesses have to do?
Suddenly, business would be forced to borrow money to start a new venture or expand. What do you think would happen? If you guessed: "new job creation would be significantly reduced", you'd be absolutely correct.
BTW, if you think the top 1% have been getting a free ride, compare the above graph (share of national income) to the next one (share of federal taxes):

I never see it mentioned how one unintended consequence of a progressive tax schedule is that it drives up the compensation for talented managers, engineers, etc. that are hired by companies who need to attract such talent.
Per force of mathematics.
bkmk
Are your charts for individuals or for households?
Is this argument based on the “Entourage” effect?
Top incomes are higher than they were, at least according to the indices most economists use for those measurements, and the disparities between income levels are increasing:
Congressional Budget Office numbers: 1979 to 2007
http://www.cbo.gov/doc.cfm?index=12485
CIA World Fact Book comparison of income inequality:
https://www.cia.gov/library/publications/the-world-factbook/fields/2172.html
(The U.S. income gap, according to the CIA, is widening,
not flat, and it’s much closer to the disparities in places
like Zambia, Zimbabwe and Panama than it is to countries
like Iceland or Denmark.)
BUT
and this is a really big “But”
....if you count Drama, Turtle and “E” along with Vince, in the highest bracket, you can make the curve flatten out?
Households. The original source is derived from IRS tax return data. It's compiled by the Congressional Budget Office.
However, they aren't my charts. I just happened to encounter them in a search, and found them very useful. You can find the entire set, and the source data, here:
As they are for households, then they suffer from exactly the artifact exposed by the article. Individual income inequality has changed hardly at all. Household inequality has changed a bit because of what I, if I may, term the “Bell Curve Effect”.
I see your point, but for most I think the "Gini coefficient" is a metric they can't understand. And even if they do, it's hard to penetrate the "it's unfair" meme.
I don't think there's any point in denying that the average for the top 1% (and the top 20%) has grown more than the lower brackets. It's done so mostly during the boom periods in the economy, because they risked their money to help fund the boom. Without that incentive for capital gains, that money would have been parked on the side: just like it is now. And there would have been no boom.
However, I think it's demagoguery to focus on the absolute amount, rather than the share of income. The top 1%'s share of national income has only doubled in the past 28 years, and their share of the federal tax burden has also doubled. As a result, the tax burden on the lower 80% has been reduced significantly.
The other problem is that all of these comparisons assume that income categories are static: meaning that someone spends their entire life in a particular category. A CBO study over a 5-year period found that isn't true: about half of the people in the lowest 20% had climbed into a higher category. In general, people moved up into higher categories, and new entries into the workforce filled in the bottom.... keeping the cycle going.
Disclaimer: Opinions posted on Free Republic are those of the individual posters and do not necessarily represent the opinion of Free Republic or its management. All materials posted herein are protected by copyright law and the exemption for fair use of copyrighted works.