Here you go. You won't find your assumption like you expect.
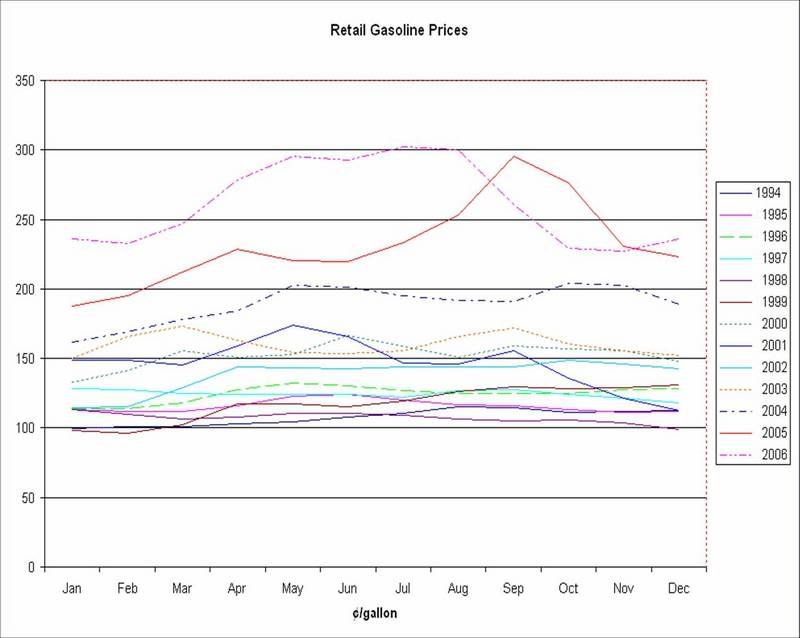
U.S. Regular All Formulations Retail Gasoline Prices
http://tonto.eia.doe.gov/dnav/pet/hist/mg_rt_usw.htm
On a monthly basis, a summer run up is not very common.
Very educational chart, but how in the world could you possible see a Memorial Day surge on a chart that has 5 year increments. You would need to see weekly details in order to discern it.
You're the one who made the assertion. An honest person wouldn't make a statement like that if he didn't have evidence. Where's your evidence?
Here you go. You won't find your assumption like you expect.
U.S. Regular All Formulations Retail Gasoline Prices
http://tonto.eia.doe.gov/dnav/pet/hist/mg_rt_usw.htm
On a monthly basis, a summer run up is not very common.