-—<>-—<>-—<>-—<>-—<>-—
Don’t forget, now, the blogs.
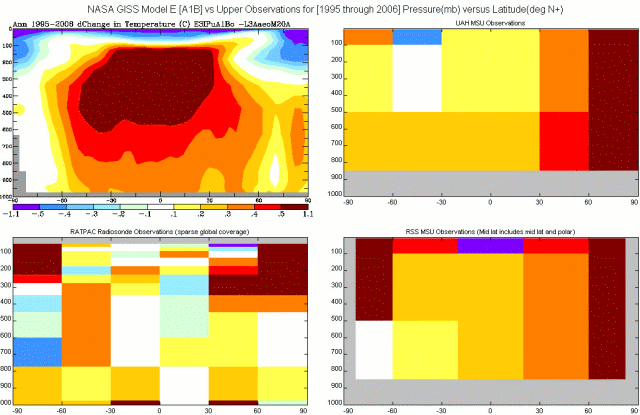
One of the most effective charts I have seen recently depicting the actual DATA (I keep coming around to that) and comparing it to the “computer models” the IPCC and the alarmists so depend on to "Prove Man is Responsible for Global Warming/ Climate Change" was posted by “Climate Watcher”
http://climatewatcher.blogspot.com/
I have it below -— Briefly, one of the BEST “Models” was run for periods that we actually have decent DATA for, and the model’s expectations were compared to the actual DATA ... “Climate Watcher” did a great service with his graphical description, I think.
There is a passing similarity in some parts of the model’s predictions to the actual DATA, but anyone believing we ought to gamble on the order of 5% or more of the world’s economy based on this type of flimsy evidence “tilting at windmills” that won’t be built for many decades needs to have their head examined. SOMETHING is clearly not right with the way these models are now programmed. The fact that they only include about 15% of the Sun’s output that hits the earth as affecting temperatures, clearly to me, suggests that as highly likely be a fruitful avenue for further exploration.
“The upper left panel is from the NASA GISS model E output of temperatures from 1995 through 2006. The trends include known forcings to 2003 and follow the A1B scenario forcings after 2003.
“The upper right panel depicts observed temperatures since 1995 from the UAH MSU.
The lower right panel depicts observed temperature change from the RSS MSU record since 1995.
The lower left panel depicts temperature change in the radiosonde data (RATPAC) since 1979.”
Altitude (by pressure in millibars) is on the vertical scale.
Latitude (from equator - Arctic on the right) is on the horizontal scale.