According to the current trading prices of the futures contracts, an estimate can be found of what traders are betting will be the outcome of 2004 Presidential Election.
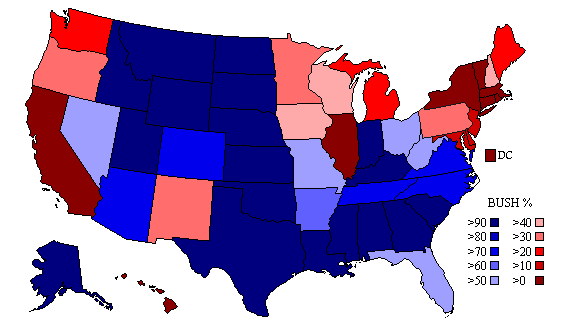
If the traders are correct, President Bush would receive 274 Electoral Votes and John Kerry would receive 264 Electoral Votes.
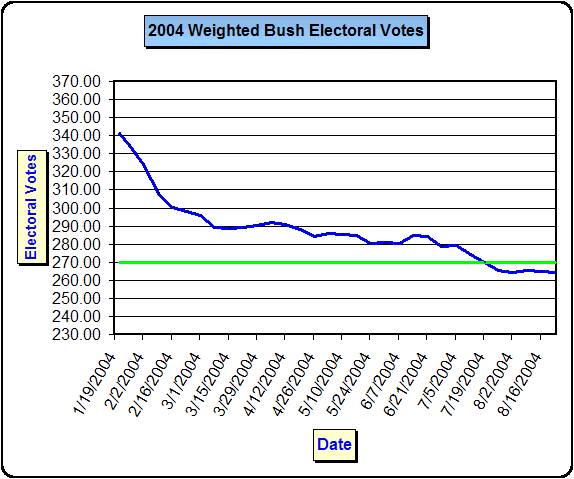
If the weighted probabilities of President Bush winning in the states are added up, and then divided by 538, and multiplied by 100, then President Bush should get 264.27 Electoral Votes.
270 Electoral Votes are needed to win the Presidency.
Opinions and commentary are welcome.
2004 Projected Presidential Electoral Votes as of 8/16/2004
2004 Projected Presidential Electoral Votes as of 8/9/2004
2004 Projected Presidential Electoral Votes as of 8/2/2004
2004 Projected Presidential Electoral Votes as of 7/26/2004
2004 Projected Presidential Electoral Votes as of 7/19/2004
2004 Projected Presidential Electoral Votes as of 7/12/2004
2004 Projected Presidential Electoral Votes as of 7/5/2004
2004 Projected Presidential Electoral Votes as of 6/28/2004
2004 Projected Presidential Electoral Votes as of 6/21/2004
2004 Projected Presidential Electoral Votes as of 6/14/2004
2004 Projected Presidential Electoral Votes as of 6/7/2004
2004 Projected Presidential Electoral Votes as of 5/31/2004
2004 Projected Presidential Electoral Votes as of 5/24/2004
2004 Projected Presidential Electoral Votes as of 5/17/2004
2004 Projected Presidential Electoral Votes as of 5/10/2004
2004 Projected Presidential Electoral Votes as of 5/3/2004
2004 Projected Presidential Electoral Votes as of 4/26/2004
2004 Projected Presidential Electoral Votes as of 4/19/2004
2004 Projected Presidential Electoral Votes as of 4/12/2004
2004 Projected Presidential Electoral Votes as of 4/5/2004
2004 Projected Presidential Electoral Votes as of 3/29/2004
2004 Projected Presidential Electoral Votes as of 3/22/2004
2004 Projected Presidential Electoral Votes as of 3/15/2004
2004 Projected Presidential Electoral Votes as of 3/8/2004
2004 Projected Presidential Electoral Votes as of 3/1/2004
2004 Projected Presidential Electoral Votes as of 2/23/2004
2004 Projected Presidential Electoral Votes as of 2/16/2004
2004 Projected Presidential Electoral Votes as of 2/9/2004
2004 Projected Presidential Electoral Votes as of 2/2/2004
2004 Projected Presidential Electoral Votes as of 1/26/2004
2004 Projected Presidential Electoral Votes as of 1/21/2004
WV flips to sKerry (from 50.1% Bush) and they predict a tie. 269-269. I don't think it is this close though.
Seems to depend on Florida, Missouri, and Ohio. If W holds them, he wins.
They've got W winning if he holds FLA, MO, and WV. They've got him losing IA, MN, NH, NM, OR, PA, and WI and still winning the election. Looks good if he can really win FLA.
This model doesn't take into effect the outcome if Colorado's Electoral votes are split.
Anybody from Colorado know what the odds of this EV split passing on the Nov ballot?
It may get a bit worse in the short-term. However, after our convention and the 9/11 anniversary, I think we will start to see a move towards W in the electoral college.
 Thanks for posting this frequently and for the ping.

Then weighted probabilities would predict a Bush loss, but the traders predict a Bush win? Why the discrepancy?
Why is everyone gleefully predicting a big bounce from the convention and 9/11? Do we not know that the media controls how these things are seen by the public? The media is more DNC-friendly than ever before, and they have rationalized it by
saying they have to counter FOX. So there will be no bounce.
Seeing that your weighting method gives Bush less votes, its apparent that he will loose Kerry states by a wider margin than he will win his own. I don't think you can weight the way you did and get any accurate projection. There should be a state by state prediction.
How about PA for Bush? Oregon or Wash? MI? And what if the North and Valley down to San Diego push CA for Bush, as well? Could be a blow-out.
What scares me is all the snowbirds in Florida. Brit was reporting today that apparently there is documentation that thousands are registered to vote in both NY and FL, and at least 1000 did vote in both states in 2000, a federal offense.
| Date | Prob. Bush Win | Mean EVs | Std. Dev. |
| 01/21 | 96.8% | 341.5 | 41.1 |
| 01/26 | 95.5% | 334.8 | 40.6 |
| 02/02 | 92.2% | 323.8 | 39.7 |
| 02/09 | 83.0% | 307.8 | 40.3 |
| 02/16 | 78.4% | 300.4 | 39.4 |
| 02/23 | 76.2% | 298.2 | 39.6 |
| 03/01 | 74.5% | 295.9 | 39.3 |
| 03/08 | 68.0% | 289.2 | 39.8 |
| 03/15 | 68.0% | 288.8 | 39.0 |
| 03/22 | 68.5% | 289.3 | 38.8 |
| 03/29 | 69.4% | 290.1 | 38.8 |
| 04/05 | 71.2% | 292.3 | 39.1 |
| 04/12 | 70.4% | 290.6 | 38.1 |
| 04/19 | 68.6% | 288.1 | 36.7 |
| 04/26 | 64.9% | 284.5 | 36.3 |
| 05/03 | 66.3% | 285.7 | 36.3 |
| 05/10 | 65.6% | 285.3 | 36.8 |
| 05/17 | 65.2% | 284.8 | 36.6 |
| 05/24 | 60.0% | 280.3 | 36.9 |
| 05/31 | 61.1% | 281.2 | 36.8 |
| 06/07 | 60.5% | 280.6 | 36.5 |
| 06/14 | 65.0% | 285.0 | 36.6 |
| 06/21 | 63.9% | 284.0 | 36.8 |
| 06/28 | 58.4% | 278.8 | 36.7 |
| 07/05 | 58.7% | 279.1 | 36.7 |
| 07/12 | 53.1% | 274.2 | 36.5 |
| 07/19 | 48.2% | 269.8 | 35.7 |
| 07/26 | 43.4% | 265.6 | 35.0 |
| 08/02 | 42.1% | 264.3 | 34.7 |
| 08/09 | 42.9% | 265.2 | 34.5 |
| 08/16 | 42.6% | 264.9 | 34.2 |
| 08/23 | 41.8% | 264.3 | 34.5 |