
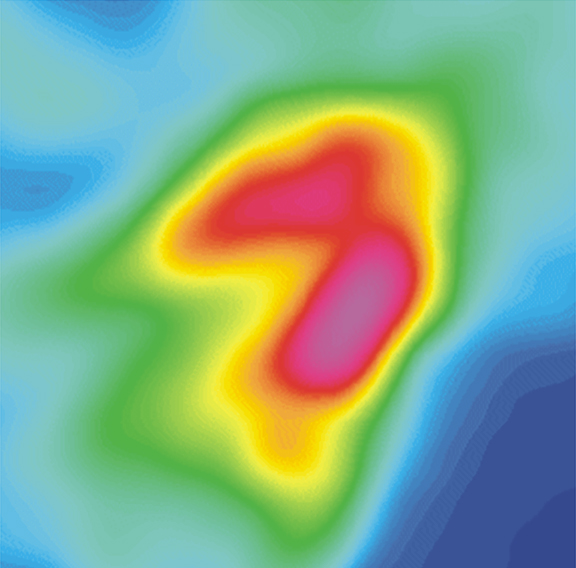
Smoothed Chandra Image of M17 without Point Sources
This version of Chandra's observation of M17 has been processed to emphasize
the diffuse emission in the cluster. In this image, the point sources have been
removed and then the pixels have been slightly blurred, or smoothed, together.
Red represents lower energy X-rays (0.5-2 keV) and blue shows a higher range of
X-rays (2-7 keV).
Scale: Image is approx. 17 arcmin per side
(Credit: NASA/CXC/PSU/L.Townsley et al.)
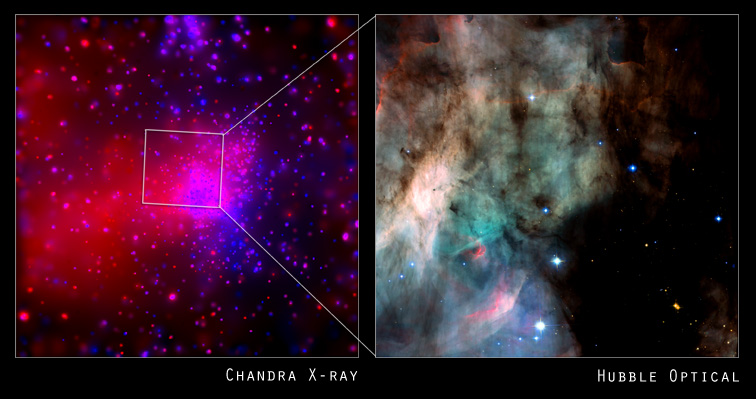
Chandra & Hubble Comparison of M17
The image on the right shows M17 in visible light as
observed by the Hubble Space Telescope compared with
Chandra's larger field of view on the left. Using the
Advanced Camera for Survey instrument (ACS), Hubble
observed M17 for 2.6 hours on April 1-2, 2002.
Scale: Left: 17 arcmin per side; Right: 2.5 arcmin per side
(Credit: X-ray: NASA/CXC/PSU/L.Townsley et al.; Optical: NASA/STScI/ESA)

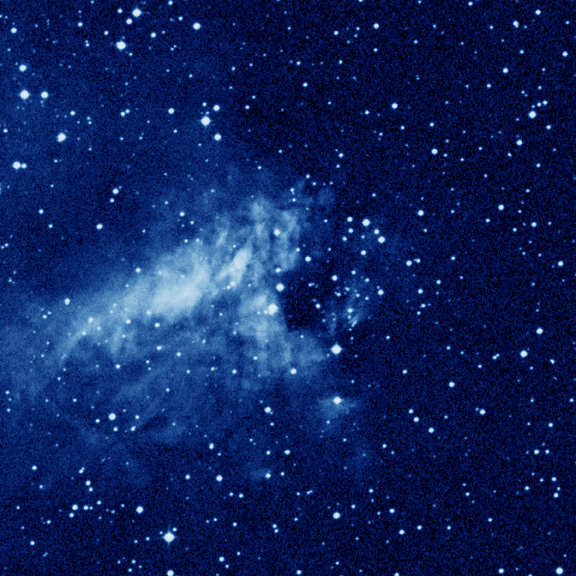
2MASS Infrared Image of M17
This infrared image of M17 from the 2MASS project
penetrates the the dust in this nebular to reveal
the otherwise invisible dark molecular cloud.
This giant molecular cloud (a cold, dense interstellar cloud which
contains a high fraction of molecules) is one of the most luminous and
active star-forming regions in the Milky Way. Although the gas in the
molecular cloud is too cold to emit visible or near-infrared light, traces of
the densest portions of the cloud can still be seen as dark, cloudy structures.
Scale: Left: 17 arcmin per side; Right: 60 arcmin per side
(Credit: 2MASS/UMass/IPAC-Caltech/NASA/NSF)
Note: 2MASS refers the 2 Micron All Sky Survey.
DSS Optical Image of M17
The Digital Sky Survey (DSS) image reveals an irregular
shaped cloud of illuminated gas, with darker superimposed regions.
The obscured areas are due to dust grains located in the foreground of the nebula.
Even the obscured regions are not completely dark, suggesting that the stars are either in the foreground
or are in the outer fringes of the dusty regions and are bright enough to be seen through the haze.
This optical image covers the same region of sky as the Chandra data.
Scale: Image is approx. 17 arcmin per side
(Credit: Palomar Observatory DSS)
VLA Radio Image of M17
The radio image of M17 depicts the distribution of ionized hydrogen
(hydrogen atoms with their electrons stripped away) in what astronomers refer to as "H II regions".
The missing electrons are the result of collisions with other atoms and/or radiation from nearby stars.
H II regions are the signposts for active star formation.
The radio image covers the same region of sky as the Chandra data.
Scale: 17 arcmin per side
(Credit: NRAO/AUI)
M17 in Sagittarius
| Right Ascension | 18 : 20.8 (h:m) |
|---|---|
| Declination | -16 : 11 (deg:m) |
| Distance | 5.0 (kly) |
| Visual Brightness | 6.0 (mag) |
| Apparent Dimension | 11.0 (arc min) |
Here's a nice amateur photo of M17.

Finder chart:

