Posted on 09/04/2023 10:36:18 AM PDT by zeestephen
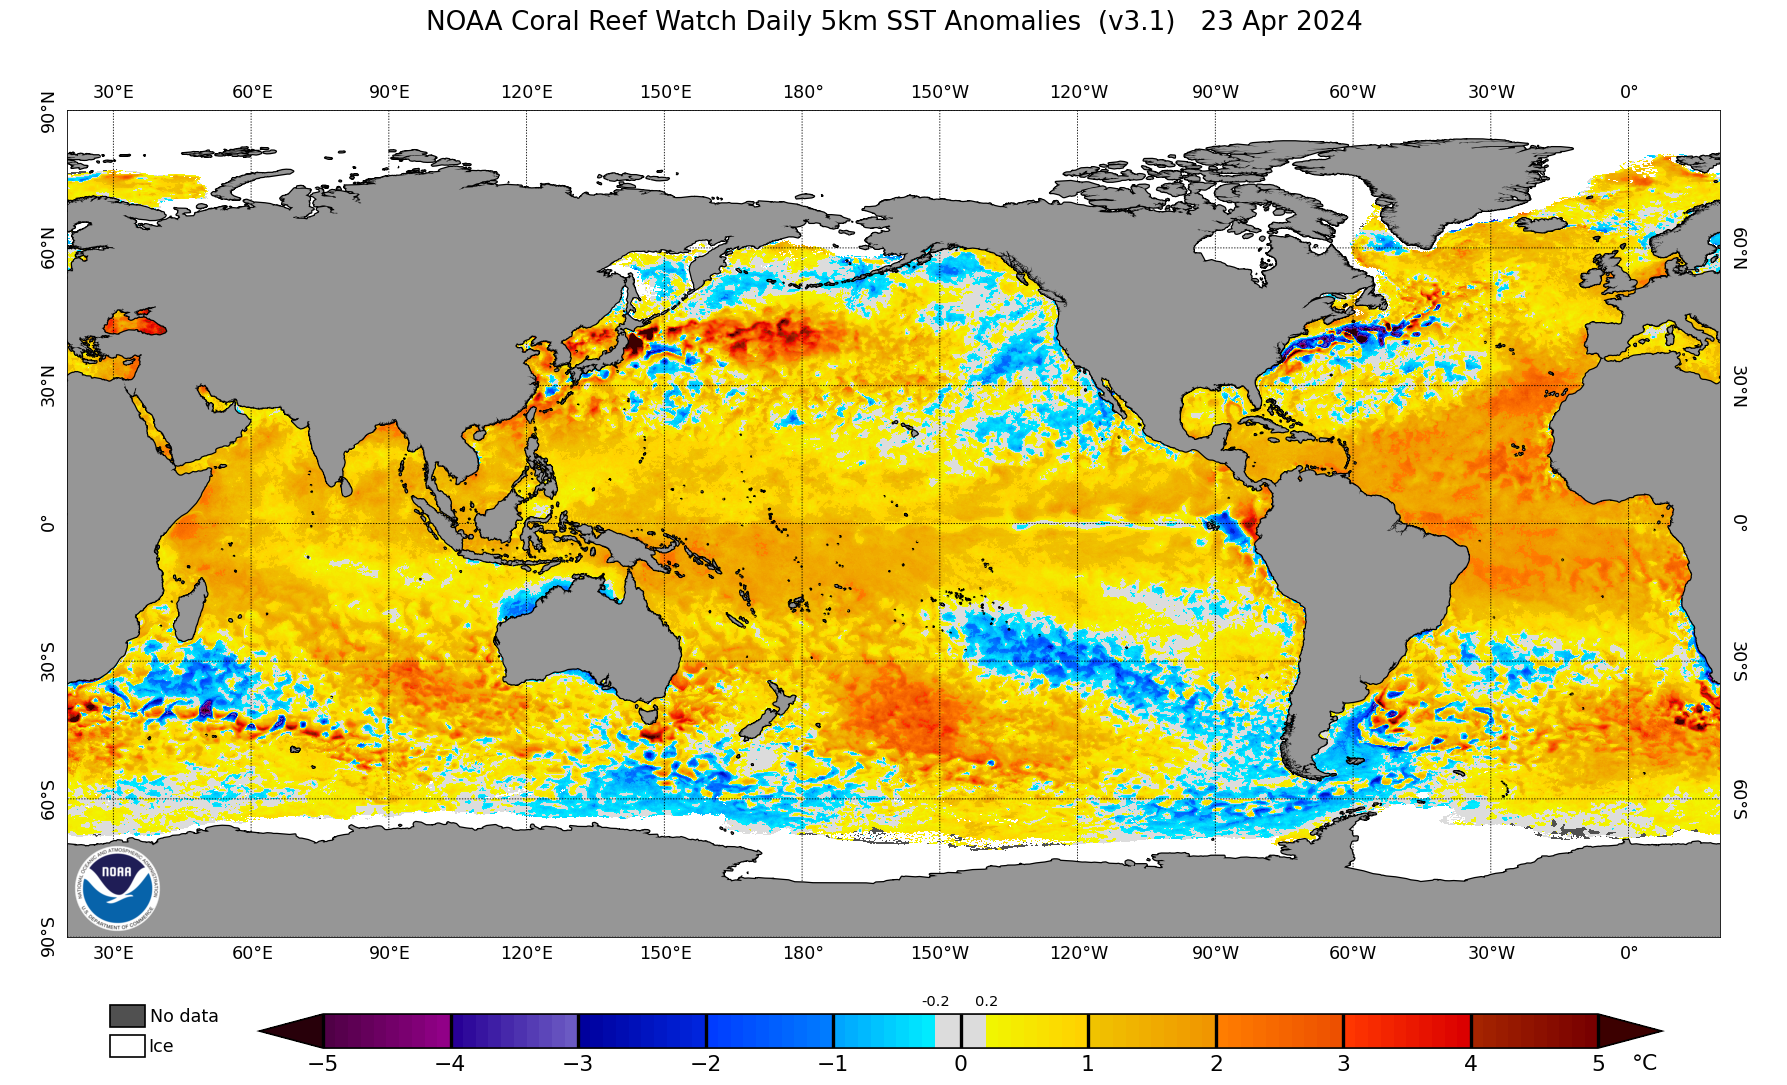
Color coded global ocean temperature map - Scroll down right side of WUWT website for ENSO-SST map and many other charts and maps - Please note that almost 100% of the unusually warm ocean water is north of the Equator, where 90% of Earth's population lives - The warm water on the northwest coast of South America is El Nino, which streams straight east across the Pacific Ocean from the Indonesian Islands. It looks like El Nino is coming to an end, but I am not an expert, so possibly the warm water current is sub-surface for the first half of the journey?
(Excerpt) Read more at wattsupwiththat.com ...
Thank you for your post.
So how does this affect our weather and hurricanes?
Thank you.
El Nino and La Nina just more natural stuff on Earth
Anyone ever notice that with everything ‘they’ say they know about weather and climate, ‘they’ still can’t accurately predict El Nino/La Nina?
As you would expect, it's very complicated and a big topic of debate in the climate and weather world. NOAA wrote this summary nine years ago...
Impacts of El Niño and La Niña on the hurricane season
By Gerry Bell, May 30, 2014
NOAA at Climate.gov
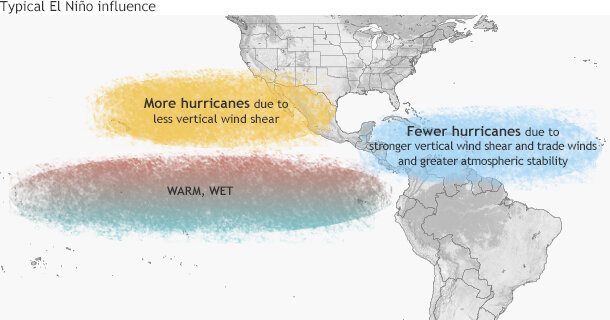
Simply put, El Niño favors stronger hurricane activity in the central and eastern Pacific basins, and suppresses it in the Atlantic basin (Figure 1). Conversely, La Niña suppresses hurricane activity in the central and eastern Pacific basins, and enhances it in the Atlantic basin (Figure 2).
These impacts are primarily caused by changes in the vertical wind shear, which refers to the change in wind speed and direction between roughly 5,000-35,000 ft. above the ground. Strong vertical wind shear can rip a developing hurricane apart, or even prevent it from forming.
Lot's more detailed info on El Nino and La Nina here...
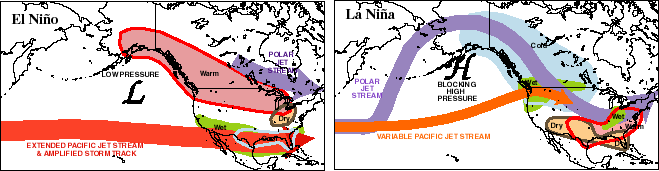
The ENSO Cycle
El Niño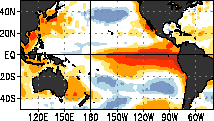
La Niña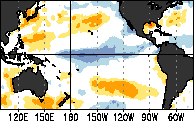
I live in Seattle, and El Nino years are typically warmer and drier than normal.
However, the past 12 months have been very unusual because we had a giant mass of colder than normal Pacific Ocean water pressed up against the coast for like six months!
We had record cold months from February through April. All the rain storms that usually hit Seattle during those months moved south and drenched coastal California cities and dropped record snow fall on their interior mountains.
Pacific equatorial subsurface temp and temp anomaly
http://www.bom.gov.au/cgi-bin/wrap_fwo.pl?IDYOC002.gif
Pacific Ocean 150m temp and temp anomaly
http://www.bom.gov.au/cgi-bin/wrap_fwo.pl?IDYOC002.gif
Site link http://www.bom.gov.au/marine/sst.shtml
What is your take on the current El Nino?
From memory, El Nino surface water usually has some red color at least two thirds of the way across the Pacific.
Is this El Nino just starting?
Or, is this El Nino just starting to end?
11-12 year solar cycles drive Pacific Ocean circulation. They come in pairs, with even-numbered cycles being equatorial and odd-numbered cycles being polar. El Niños happen near the peaks of odd-numbered cycles.
El Niños happen when the two Pacific oceans stop turning outwardly, and compress to center circulation. The western hot water migrates back to the eastern equatorial Pacific.
We are nearing the peak of solar cycle 25 where we should see an El Niño. However, solar cycle 24 was so weak that the weakened pacific circulation allowed an El Niño to occur starting two years early.
The North Pacific circulation (PDO) slings kinks into our northern atmospheric jet stream, and causes North America’s cold fronts and monsoon rains. The current western drought is happening because of weakened North Pacific circulation, and ultimately because of weak solar output.
Just starting… I follow this stuff but not an expert.
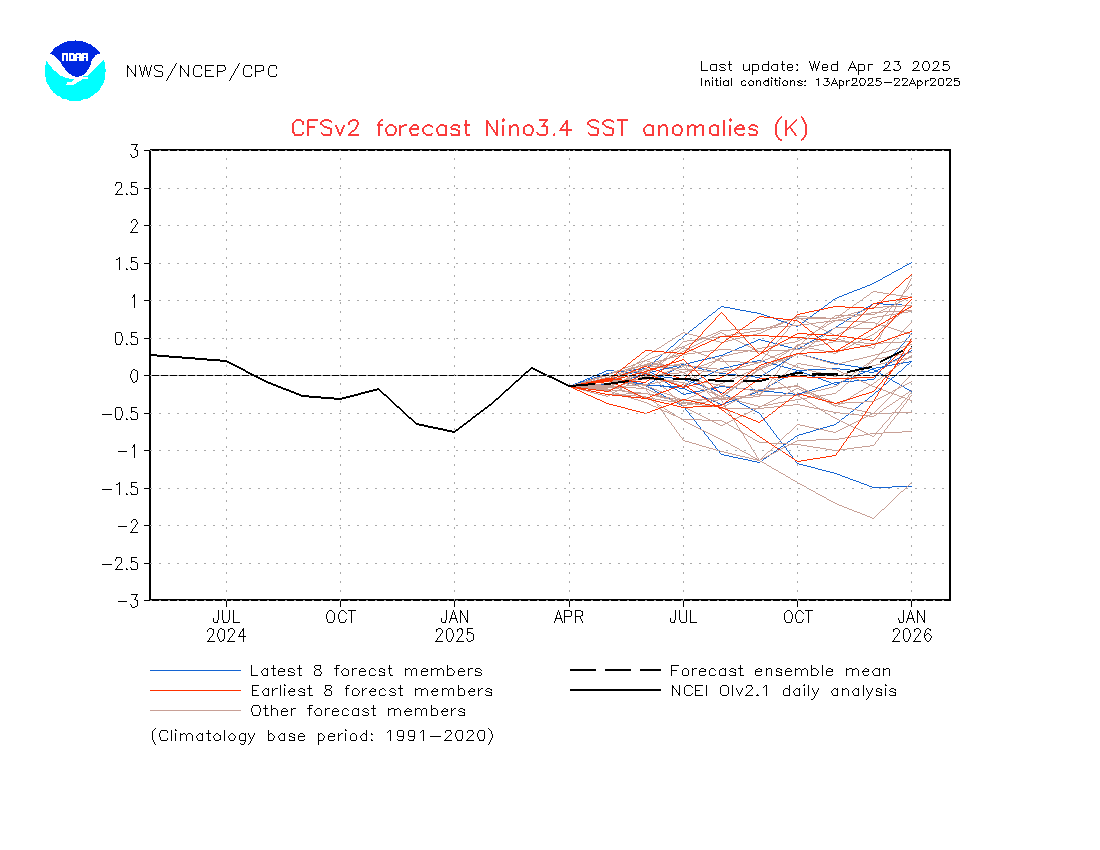
The sea surface temp for the El Niño (and La Niña) is called Nino3.4
https://www.ncei.noaa.gov/access/monitoring/enso/sst
Forecast currently say it will peak about November but will only slow fade through next Spring
https://www.cpc.ncep.noaa.gov/products/CFSv2/imagesInd3/nino34Mon.gif
The is a weekly update that come out on monday morning but today is a holiday
It also important to pay attention to what the Australians say:
“Sea surface temperatures (SSTs) in the tropical Pacific are exceeding El Niño thresholds and have continued to warm slightly over the last fortnight. Climate models indicate further warming of the central to eastern Pacific is likely, with SSTs remaining above El Niño thresholds until at least early 2024.
The 90-day Southern Oscillation Index (SOI) is presently just below El Niño thresholds, while trade winds and Pacific cloudiness have not yet demonstrated sustained El Niño patterns. Overall, atmospheric indicators suggest the Pacific Ocean and atmosphere are not yet consistently reinforcing each other, as occurs during El Niño events. …”
http://www.bom.gov.au/climate/enso/
The Southern Oscillation Index monitors atmospheric changes: the pressure difference at Tahiti vs Darwin. atmospheric changes are what’s important
Does this mean we are all gonna die...AGAIN????
ENSO fluctuations are becoming more predictable since it has been shown to relate to lunar cycles, trade winds and tides. The 2015-16 El Niño was in fact accurately predicted by a researcher cited at WUWT as was the current nino. Don’t worry though, the ENSO has nothing to do with CO2 levels.
Disclaimer: Opinions posted on Free Republic are those of the individual posters and do not necessarily represent the opinion of Free Republic or its management. All materials posted herein are protected by copyright law and the exemption for fair use of copyrighted works.